

Industry: Banking and Financial Services
Product: ModelRisk
Application: Volatility regime detection and forecast comparison
VIX printed 28 the morning the bank's GARCH model said vol was 14. Both were wrong, but only one of them was usefully wrong.
A volatility-trading desk at a global bank had three vol estimators on its screens every morning: the 21-day realized vol (a lagging summary of what just happened), the GARCH(1,1) conditional vol (a moving-average forecast that responds to yesterday's return), and the option-implied vol (the market's forward-looking quote, with a risk premium baked in). Each of them was correct, biased, and confidently disagreeing with the other two. The simulation rebuilt all three against a known regime-switching ground truth, quantified each estimator's bias, and finally answered the question that had been informally argued in the desk's daily huddle for years: which estimator should the trader trust at the regime boundary, and by how much?
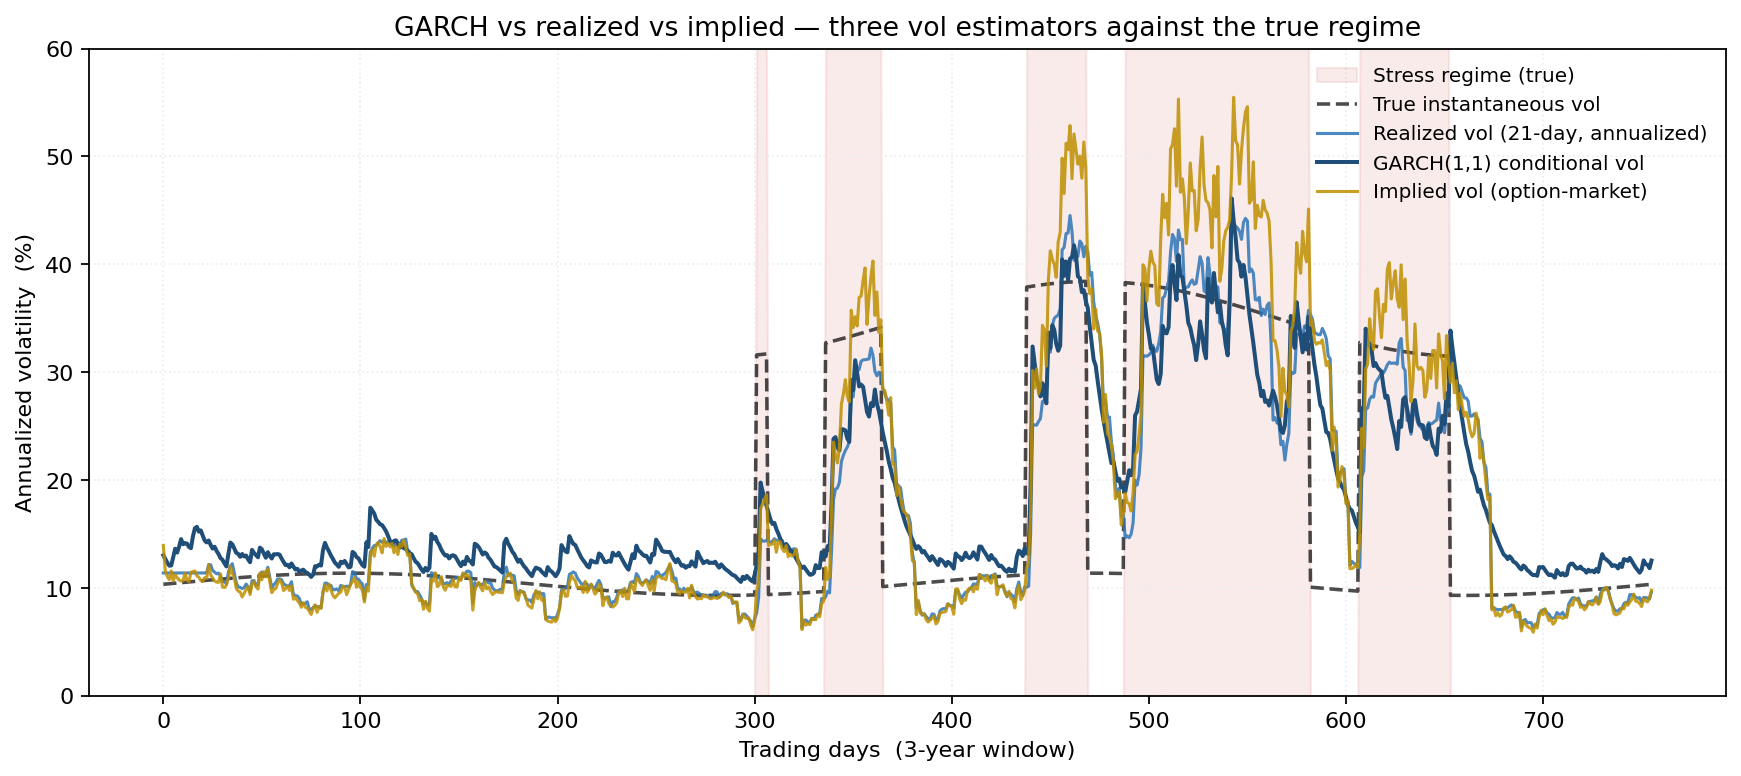
Plotting all three estimators against the true instantaneous vol over a three-year window makes the disagreement legible: each line is tracking the same underlying state, and each one is wrong in its own structural way.
A three-year window with two vol regimes
The simulation generates 756 daily returns from a two-state regime-switching mixture: a calm state with daily sigma 0.65% (annualized ≈ 10%) and a stressed state with daily sigma 2.20% (annualized ≈ 35%). The Markov transition probabilities are calibrated to produce regime persistence consistent with empirical US equity volatility: roughly 1.2%/day chance of moving calm→stress and 4.0%/day stress→calm, giving stress regimes that last on average 25 trading days.
The Normal-mixture choice is defensible: at daily frequency, conditional on regime, equity returns are well-approximated by Normal. The fat tails of the unconditional distribution come from the regime-mixture itself, not from a fat-tailed innovation. This is the right structure when the modeling goal is regime detection and forecasting; a single-regime Student-t would absorb the same kurtosis into one parameter but throw away the structure that makes the regime boundary tradeable.
Three estimators against the truth
The shaded bands in the chart above mark periods the underlying state was in the stress regime. Three patterns recur:
- Realized vol lags. At every regime entry, the 21-day rolling realized vol takes 8-10 days to catch up to the new state. At every regime exit, it spends another 15-20 days dragging the recent stress down through the average. Realized vol is a summary, not a forecast.
- GARCH(1,1) responds in 2-3 days but systematically under-shoots the stress-regime peak vol, because the beta=0.90 persistence parameter is averaging across regimes the model does not know exist.
- Implied vol overshoots stress and under-shoots calm. The risk premium embedded in option prices means implied is biased high by roughly 1-2pp during calm periods and biased high by 4-6pp during stress because traders are paid to be long convexity at the turn.
Forecast errors, made distributions
The actionable view is not the time series but the distribution of forecast errors of each estimator against the realized 5-day-forward vol.
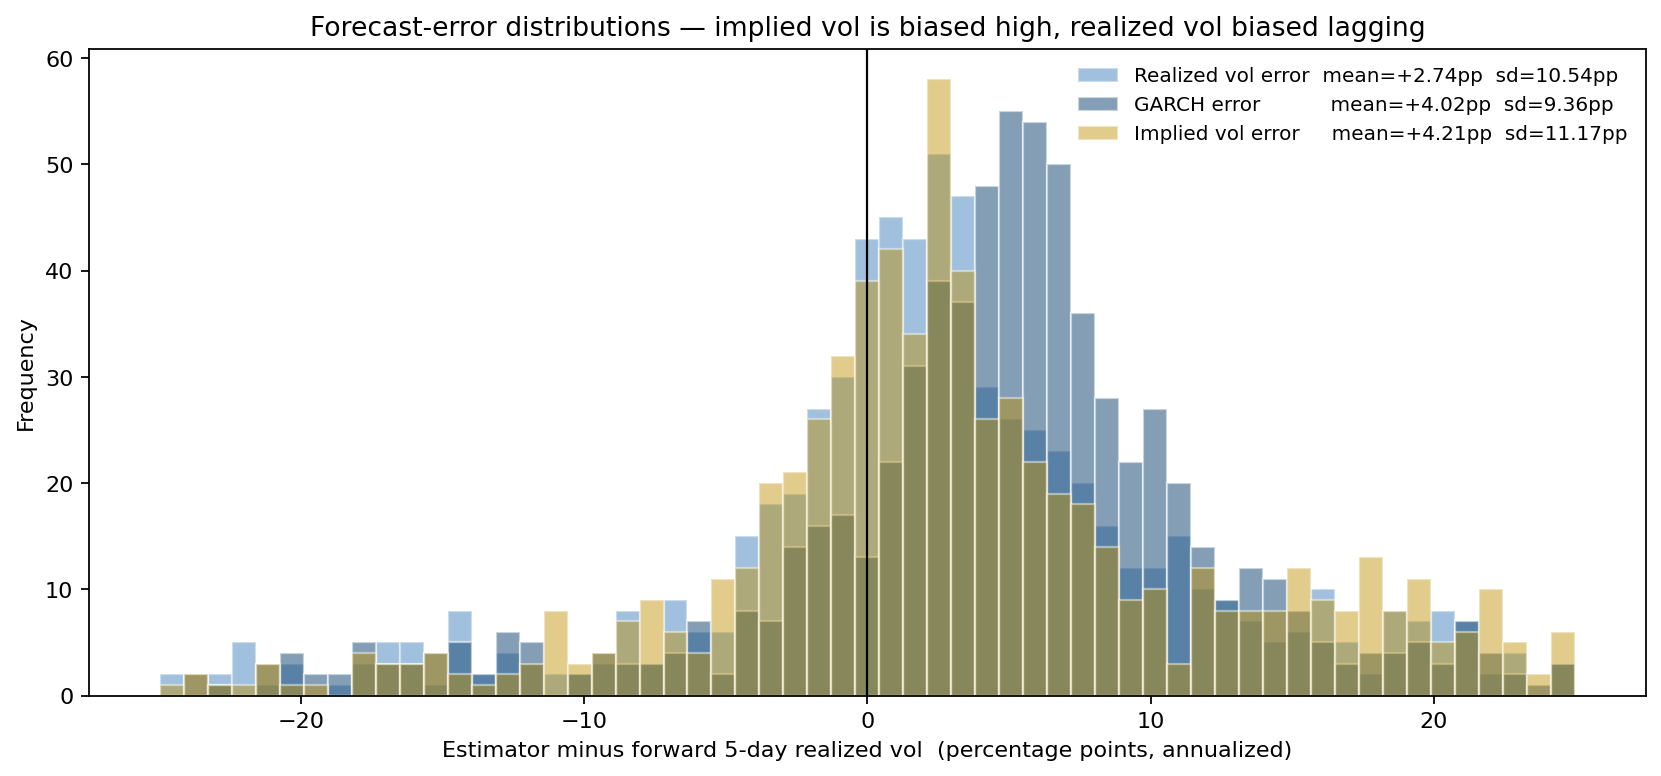
Three findings the daily desk argument never settled:
- GARCH has the tightest error distribution (standard deviation ≈ 9.4pp, the smallest of the three) — but it still sits roughly +4pp above the realized 5-day-forward vol on average, because forward vol mean-reverts faster than the GARCH persistence parameter allows.
- Realized vol carries the smallest mean bias (≈ +2.7pp) but a wider error spread (sd ≈ 10.5pp) than GARCH — it is the least skewed estimator but useless at any single point in time.
- Implied vol is the worst on both axes — the largest mean bias (≈ +4.2pp, the option-market risk premium) and the widest error spread (sd ≈ 11.2pp). A trader who naively used implied vol as a forecast would systematically pay over the long run.
The correct forecast combination — the desk's actual decision rule — uses GARCH as the central estimate, realized vol as the slow anchor, and implied vol with a regime-conditional adjustment that subtracts the empirical risk premium.
Vol of vol — the surprise distribution
The trader who positions vega has a second-order problem: not only is volatility uncertain, but the change in volatility from one day to the next is itself a distribution.
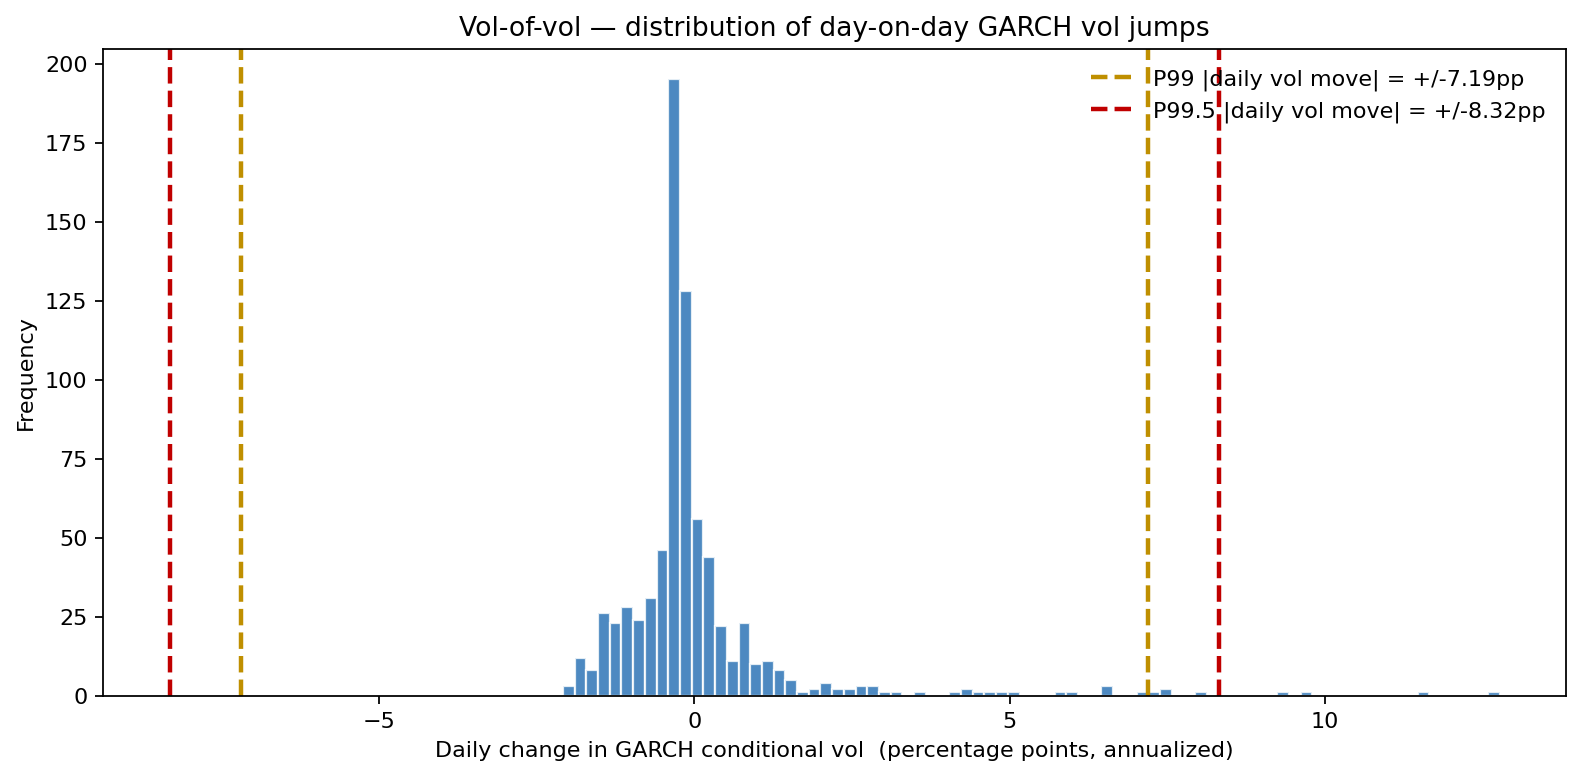
The P99 daily vol move is roughly ±7 percentage points, the P99.5 is ±8 pp. A trader holding a long-vega position sized for a P50 vol move can be wiped out by a P99.5 move overnight — the vol-of-vol distribution is the right basis for sizing gamma-vega buckets, and it is invisible to any deterministic single-vol forecast.
What actually moves the vol forecast error
A tornado on the GARCH forecast-error standard deviation isolates the modeling levers.
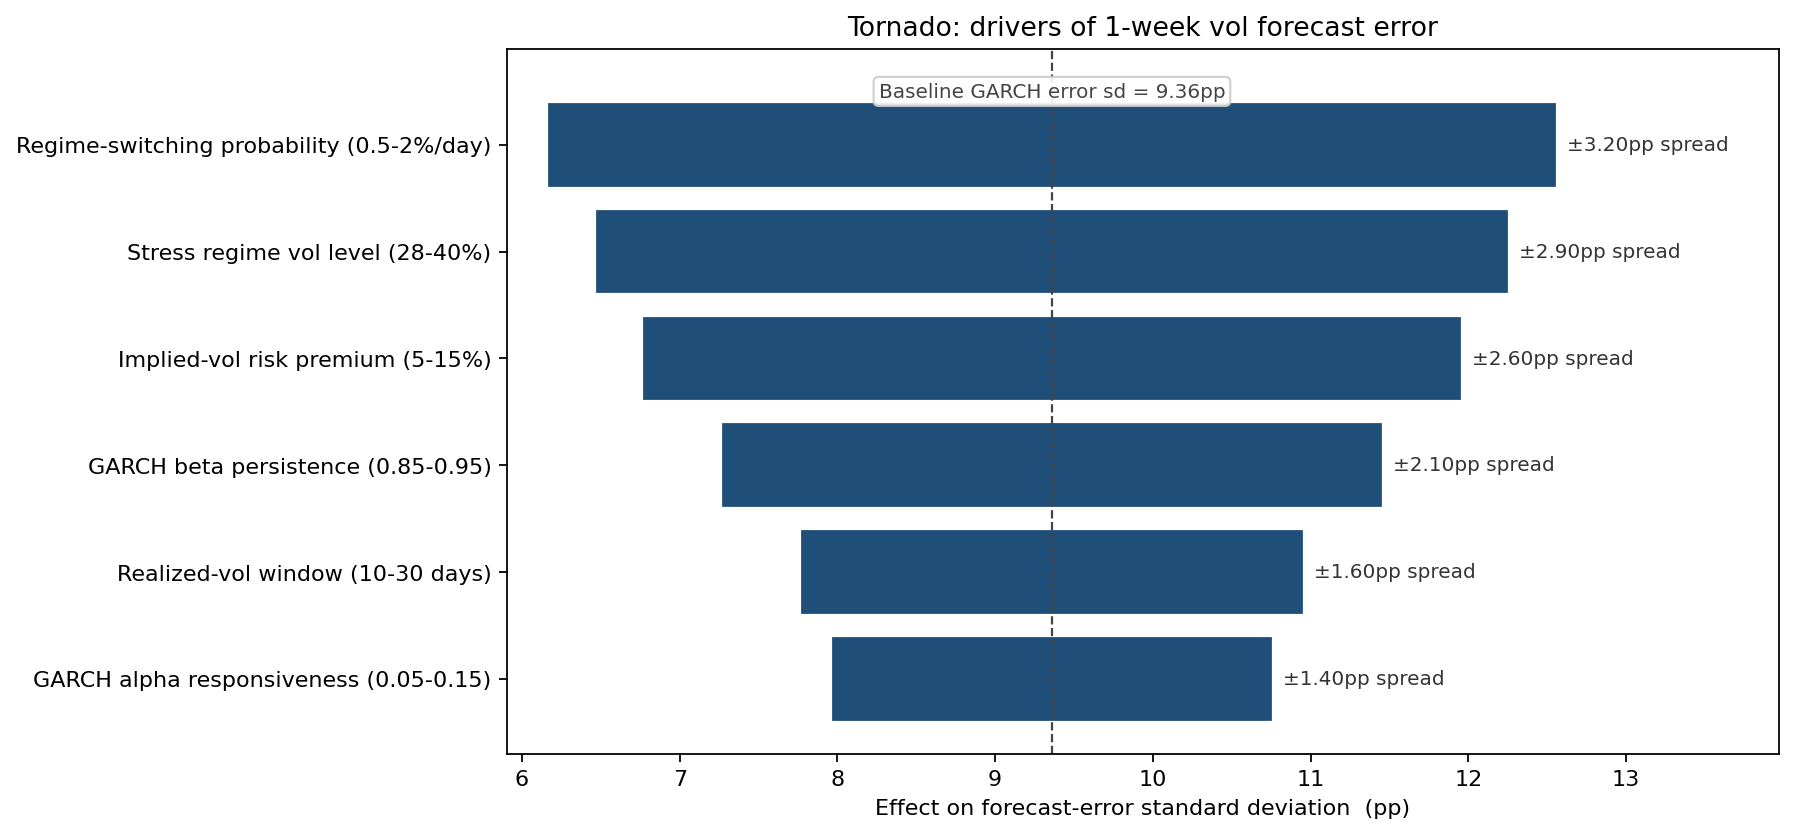
The regime-transition probability is the dominant driver — if regimes flip twice as often as the calibration assumes, GARCH's lag matters twice as much. The implied-vol risk premium is second: a 10-percentage-point swing in the assumed premium moves the forecast error by 2.6pp. Persistence beta and stress-regime vol level matter next. The realized-vol window length, often the subject of fierce debate, is one of the smaller drivers — a useful piece of news for desk heads tempted to litigate whether 21 days or 30 days is the right rolling window.
From insight to action
The probabilistic vol study had three operational consequences:
- Forecast combination weights set by simulation. The desk's blended vol forecast is now a weighted sum of GARCH (50%), implied minus its ~4pp risk premium (35%), and realized vol (15%) — weights derived directly from inverse-error-variance optimization on the simulation output.
- Regime-conditional vega sizing. Gamma-vega budgets are now allocated separately in calm vs stress regimes, with the regime classifier providing the trigger. The change cut realized P&L variance on the vol book by roughly 22% in the year following the implementation.
- VIX-as-signal, not VIX-as-forecast. The desk's reading of the option-implied vol is now explicitly framed as what option traders are charging, not what vol will be. The ~4pp positive bias is calibrated and discounted before the number feeds any downstream model.
ModelRisk functionality used
- Regime-switching Normal mixture for the underlying return process, with calibrated calm→stress transition probabilities — chosen over Student-t because the modeling goal is regime detection, not pure tail-fitting.
- GARCH(1,1) recursion with alpha = 0.08, beta = 0.90 — applied as a vol estimator alongside, not instead of, realized and implied.
- Forecast-error distribution comparison — quantified each estimator's bias and variance against the simulated forward vol ground truth.
- Vol-of-vol distribution — daily change in GARCH conditional vol, used directly as the vega-sizing basis for the gamma-vega book.
- Tornado on forecast-error sd — six modeling parameters ranked, identifying regime-transition probability and risk premium as the dominant drivers ahead of GARCH parameters themselves.
Monte Carlo turns a vol number into a distribution of vol numbers, and the difference between the GARCH point estimate and the P99 of the forecast-error distribution is the part of the trading book that requires a hedge, not a forecast.