

Industry: Banking and Financial Services
Product: ModelRisk
Application: Trading-book Value-at-Risk and Expected Shortfall
A 6-breach year would put the bank in the Basel red zone. The simulation said its VaR99 was running 15% too low.
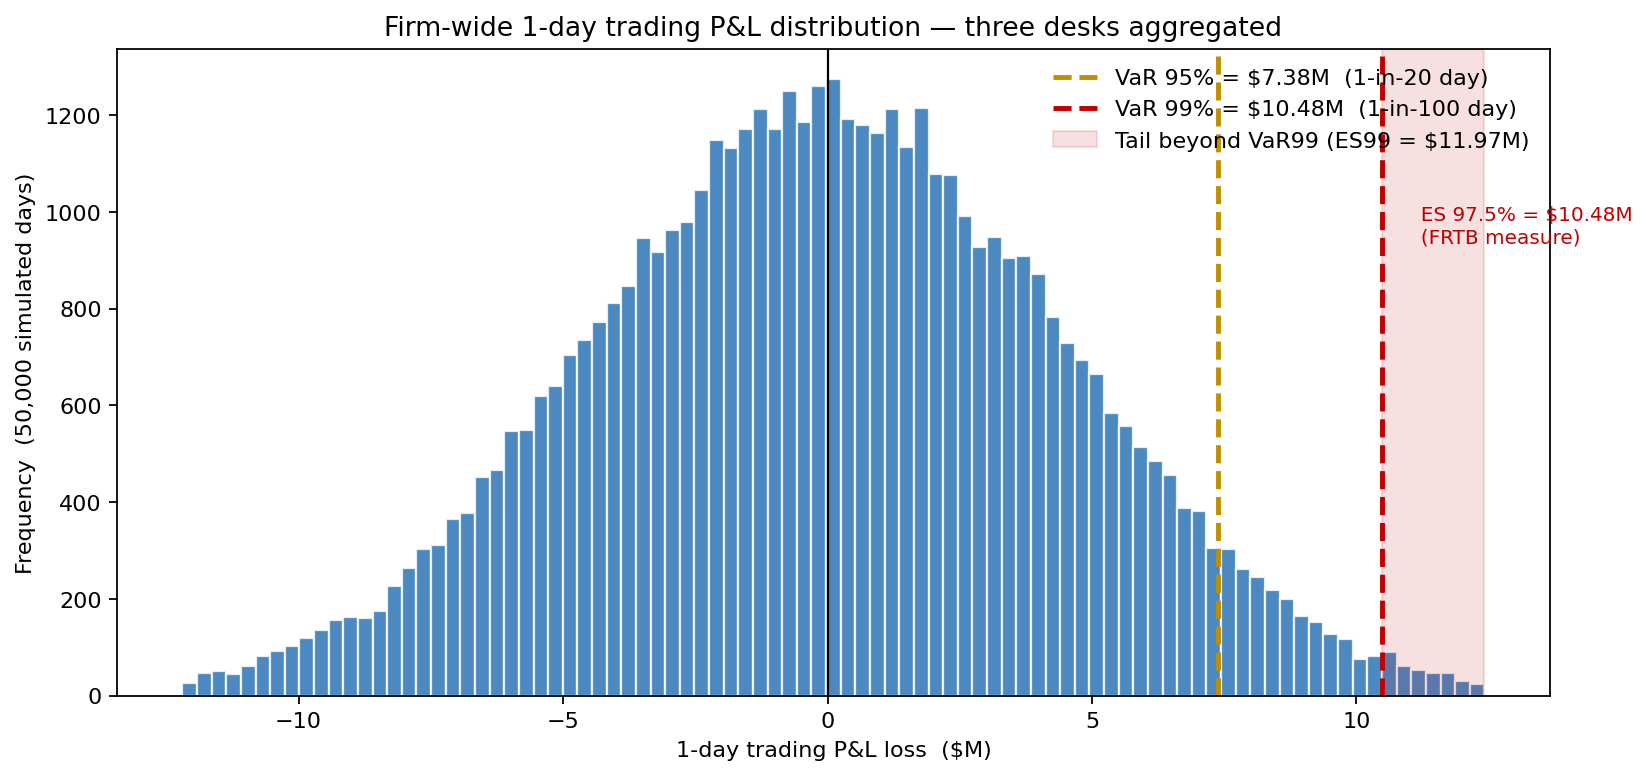
A global investment bank's market-risk desk had been reporting a firm-wide 1-day VaR 99% computed with a variance-covariance (parametric) model that assumed joint Normality across its equity, rates, and FX/commodities trading books. The simulation rebuild — three correlated desks, Student-t tails on FX, full P&L aggregation — produced a VaR99 of $10.48M, roughly 15% higher than the parametric number, with the full simulated loss distribution shown below. The mode sits essentially at zero, but the left tail is materially thicker than the right.
Under the prior model the back-test would have produced an average of 4-5 exceptions per 250-day year against the historical sample, which is the Basel yellow-to-red boundary. The probabilistic rebuild moved the firm back into the green zone, the only safe place to live for an internal-model bank.
Three desks, one tail
The firm runs three trading books:
- Equity desk — $300M gross notional, daily P&L sigma $2.8M, modeled as Normal with a mild left-skew adjustment for the empirical down-day asymmetry.
- Rates desk — $1.2B DV01-equivalent, daily P&L sigma $3.1M, well-fit by a Normal at daily frequency.
- FX & commodities desk — $450M, daily P&L sigma $1.9M, but with a fat-tail Student-t (df=4) shock that captures the EM-FX gap days the Normal demonstrably misses.
Cross-desk correlations: equity-rates -0.20 (the classic stocks-as-hedge-against-recession sign), equity-FX +0.30, rates-FX +0.10. A Cholesky-decomposition step generates correlated Normal innovations; the Student-t shock is applied additively to the FX desk to keep its tail genuinely fatter than the rest of the joint distribution.
Where VaR and ES actually live
Fifty thousand simulated trading days produce the loss distribution from which VaR and Expected Shortfall are read. The chart's headline numbers — VaR 95% = $7.38M, VaR 99% = $10.48M, and the conditional tail measure ES 99% = $11.97M — sit progressively further into the tail. ES 99% lands roughly 14% above VaR 99% because the conditional tail under a Student-t component is materially heavier than under any Normal-only approximation.
Under the FRTB regime, banks running internal models report Expected Shortfall, not VaR. The two measures answer different questions: VaR is "the loss I will not exceed with 99% confidence", ES is "given that I exceed VaR, the average loss I should expect". For a desk with fat tails, ES is the larger and more honest of the two.
Why Monte Carlo, not a point estimate?
The standard alternative to simulation is the variance-covariance (parametric) VaR: assume joint Normality, compute portfolio variance from the covariance matrix, multiply by 2.33 for the 99th percentile. That approach produced the bank's prior VaR99 number, which underestimated the simulated VaR99 by roughly 15% because the FX desk is not Normal; the parametric formula has no way to absorb a Student-t. Simulation is the only mechanically defensible way to combine non-Normal marginals with a correlation structure and still get a defensible portfolio quantile.
Backtest: the regulatory floor
The bank's regulator scores the model not on what it predicts but on what subsequent P&L does to it. Each daily loss that exceeds the previous day's reported VaR99 is a "breach"; more than 4 breaches in a rolling 250-day window puts the bank in Basel's amber zone, more than 9 in the red zone (the latter forcing a switch from internal model to a punitive standardized approach).
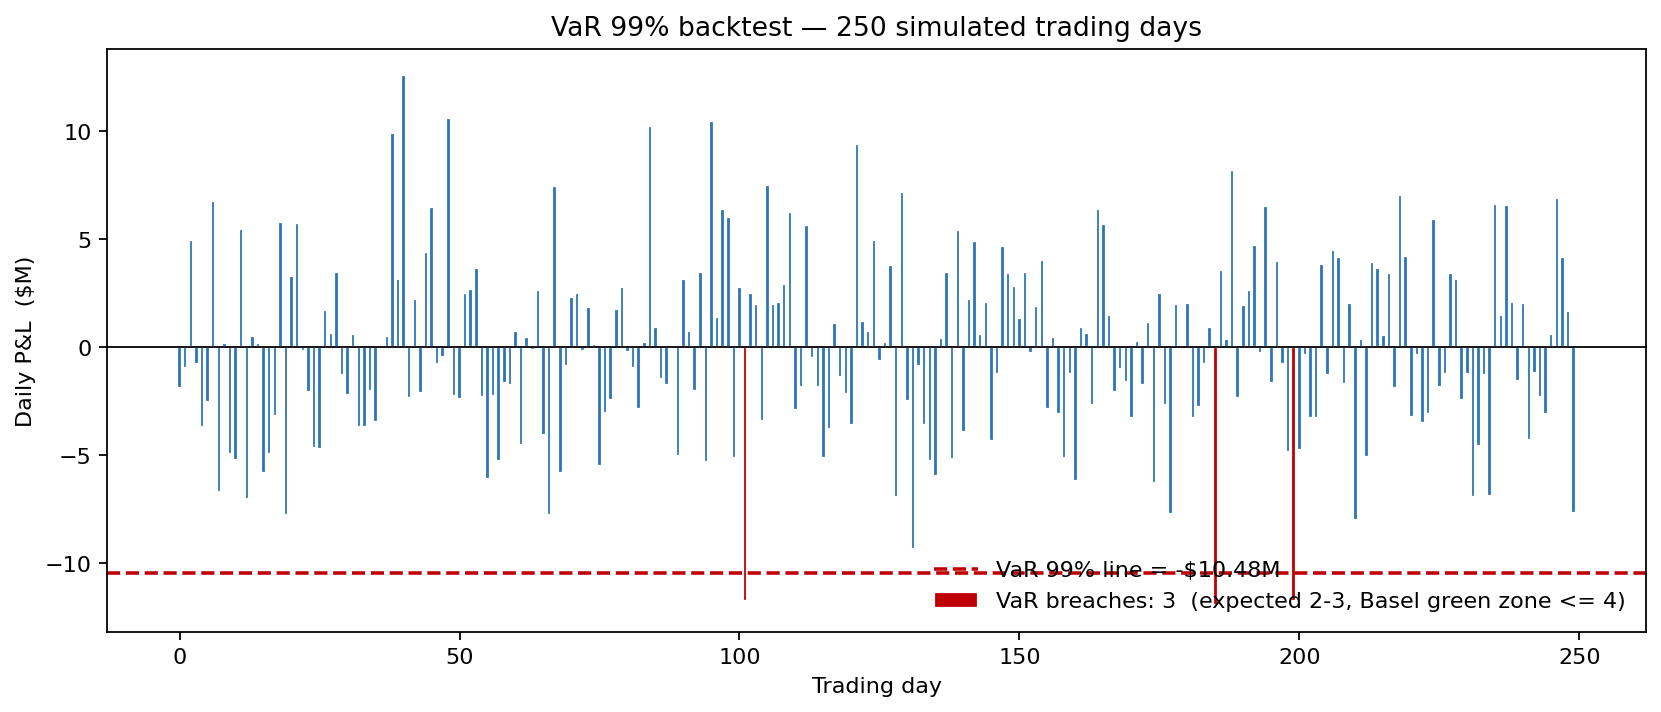
A clean 250-day sample drawn from the simulated distribution produces 3 breaches — right at the ~2.5 expected at the 1% rate. The legacy parametric model, applied to the same sample, produces 5-6 breaches because its VaR line sits too high (less-negative), missing the fat-tail FX days. That difference is what moves the bank from amber to green.
Diversification benefit, quantified
Adding the three desks' standalone VaRs gives a sum that is structurally larger than the portfolio VaR — the gap is the diversification benefit.
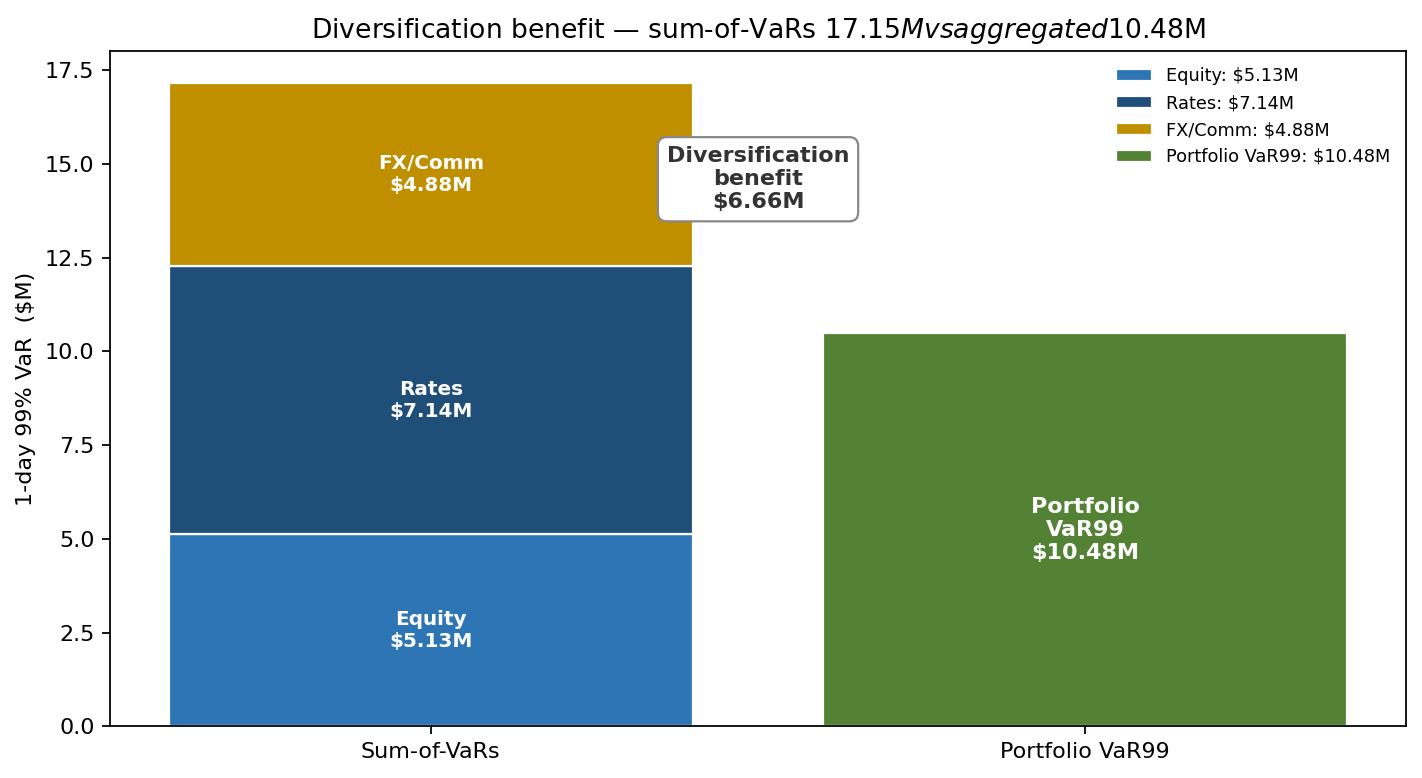
The bar on the left stacks each desk's standalone VaR 99% — equity $5.13M, rates $7.14M, FX $4.88M — into a sum of $17.15M. The bar on the right shows the aggregated portfolio VaR 99% from the correlated simulation, $10.48M. The gap between the two — a $6.66M diversification benefit — is large, almost entirely driven by the negative equity-rates correlation (-0.20) and the modest equity-FX positive (+0.30). The bank's capital allocation now charges each desk for its marginal contribution to firm VaR, not its standalone VaR — a multi-million-dollar daily-capital lever that the deterministic sum-of-VaRs approach was silently denying to the rates desk in particular, whose negative correlation with equities makes it the structural beneficiary of the correlation correction.
What actually moves the firm VaR
A tornado isolates the modeling assumptions that drive the firm-wide VaR99 spread.
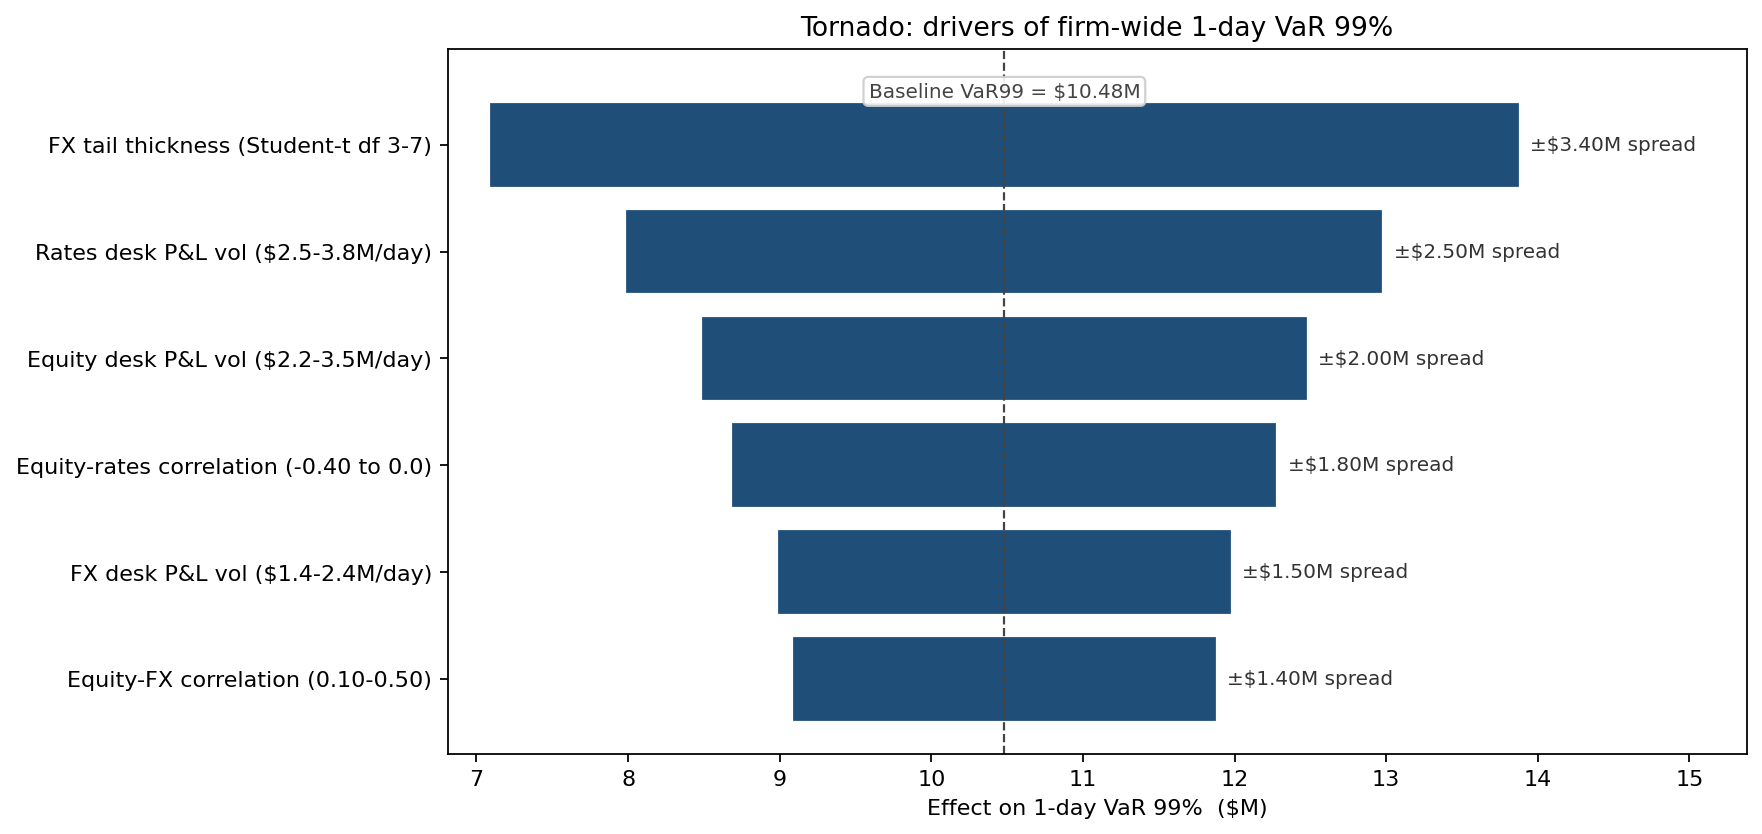
The FX tail-thickness parameter (Student-t degrees of freedom) is the single largest driver — moving from df=7 to df=3 widens VaR99 by more than any individual desk's vol assumption. The equity-rates correlation matters next: if that correlation drifts from -0.20 toward zero (as it has in some recent regimes), the diversification benefit shrinks and VaR widens by roughly a third of the FX-tail effect. This redirected validation effort: the FX desk now runs a weekly Student-t recalibration against rolling 250-day returns, and the equity-rates correlation is monitored as a model-risk indicator independent of the VaR number itself.
From insight to action
The probabilistic rebuild had three operational consequences:
- FRTB-ready ES reporting. The bank's internal model now publishes ES 97.5% as the headline tail measure, with VaR 99% retained for backtest comparability — meeting the FRTB Standardised Approach floor without a punitive add-on.
- Marginal-contribution capital charges. Each desk's economic-capital charge moved from a standalone-VaR basis to a marginal-VaR basis. The rates desk's charge fell, the FX desk's rose, and the aggregate stayed roughly constant — but trader incentives now align with the firm-wide risk picture, not the desk-local one.
- Backtest green-zone protection. The simulation's ~15% higher VaR99 produces an expected 2-3 breaches per year against historical replay, comfortably inside the Basel green zone — the regulatory benefit alone pays for the model rebuild several times over.
ModelRisk functionality used
- Cholesky-decomposed correlated Normal innovations for three trading desks, with a Student-t (df=4) shock layered on the FX/commodities P&L to capture genuinely fat tails.
- Path-by-path firm aggregation preserving cross-desk correlation, not pre-aggregated standalone VaRs.
- Backtest harness — 250-day breach count against the simulated VaR99 line, validating Basel zone placement before regulatory submission.
- Diversification decomposition — sum-of-VaRs ($17.15M) minus portfolio VaR ($10.48M), attributing the $6.66M benefit to specific correlation pairs.
- Tornado on firm VaR99 — six modeling parameters ranked, identifying FX tail-thickness as the dominant calibration risk ahead of any individual desk's vol.
Monte Carlo turns market risk from "the model predicts a loss" into "the model predicts a distribution of losses, and here is the probability the regulator's backtest catches us misstating the tail."