

Industry: Banking and Financial Services
Product: ModelRisk
Application: Liquidity Coverage Ratio and HQLA buffer sizing
The deterministic LCR was 128%. The simulation said 1-in-25 stress runs land below 100%.
A bank treasury team reporting a deterministic LCR of 128% at quarter-end — comfortably above the Basel III 100% floor — produced the simulation re-run that the regulator's stress committee actually wanted to see: under the bank's own internal "deposit run" scenario, with run-off rates and HQLA haircuts treated as distributions rather than fixed regulatory parameters, the stress LCR still centred at a healthy 129% median with a P10 of 107% — but its left tail crossed the 100% floor 3.6% of the time, roughly one stress quarter in 28. A small probability, but not the zero the single number implied — and exactly the figure a treasurer has to size a buffer against.
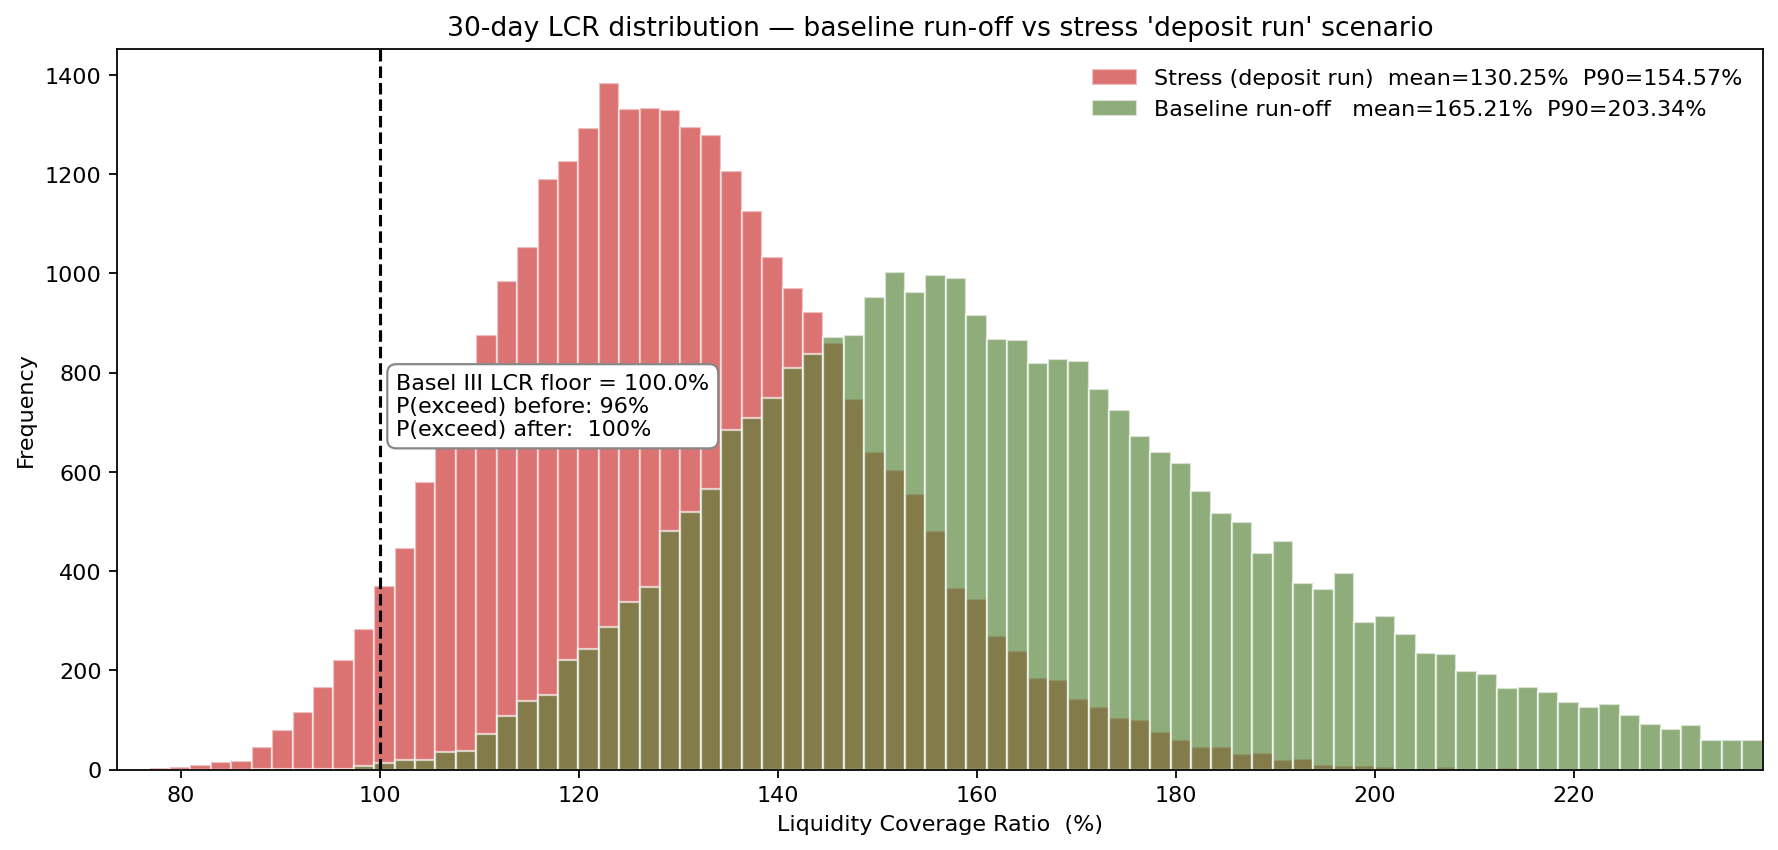
The gap between the deterministic point estimate and the stressed tail is exactly the coverage that recent SVB and First Republic post-mortems argued was missing from the standard single-number methodology.
Why a single LCR number hides the answer that matters
The standard LCR computation uses regulatory point estimates: 5% run-off on stable retail deposits, 10% on insured SME, 25% on operational corporate, 100% on unsecured wholesale. These numbers are expected run-offs under a stylized 30-day stress. Real run-off rates have distributions, and the distributions are not symmetric — under genuine stress, retail behavior is bimodal (most depositors stay, a tail does not), and the median run-off is much closer to the regulatory point estimate than the P95 is.
The treasury team modeled each deposit segment's 30-day run-off as a Beta distribution calibrated so that the mean matches the regulatory rate and the variance widens under stress:
- Retail stable ($120B): Beta with mean 5% baseline / 6.5% stress, high concentration (most paths near the mode).
- SME ($40B): Beta with mean 10% baseline / 13% stress.
- Large corporate ($35B): Beta with mean 22% baseline / 27% stress.
- Wholesale ($25B): Beta with mean 70% baseline / 78% stress — the highest run-off per dollar, because regulatory experience says wholesale funding evaporates quickly under stress.
On the asset side, HQLA haircuts on L2A and L2B assets are themselves Beta-distributed (15-45% on L2A, 50-95% on L2B). Derivative collateral calls under stress are LogNormal — mean $600M baseline, ~$850M stress, with the right-skew that historical margin-call data demands.
Two LCR distributions, one floor
Running 30,000 paths under each scenario gives the two distributions shown in the opening chart, side by side. Under baseline run-off the median LCR is roughly 161%, with a P10 of 132% — comfortably above the deterministic 128% point estimate. Under the stress scenario the distribution shifts left and widens: the median stress LCR is still a healthy 129%, but the P10 falls to 107% and the left tail crosses the 100% regulatory floor about 3.6% of the time. The deterministic stress number a treasury team would normally report — a single point estimate above 100% — hides that breach mass entirely, because the variance of the input distributions is precisely what generates the tail below the floor.
What runs first
A Pareto on the stress 30-day outflow shows which buckets actually drain the buffer.
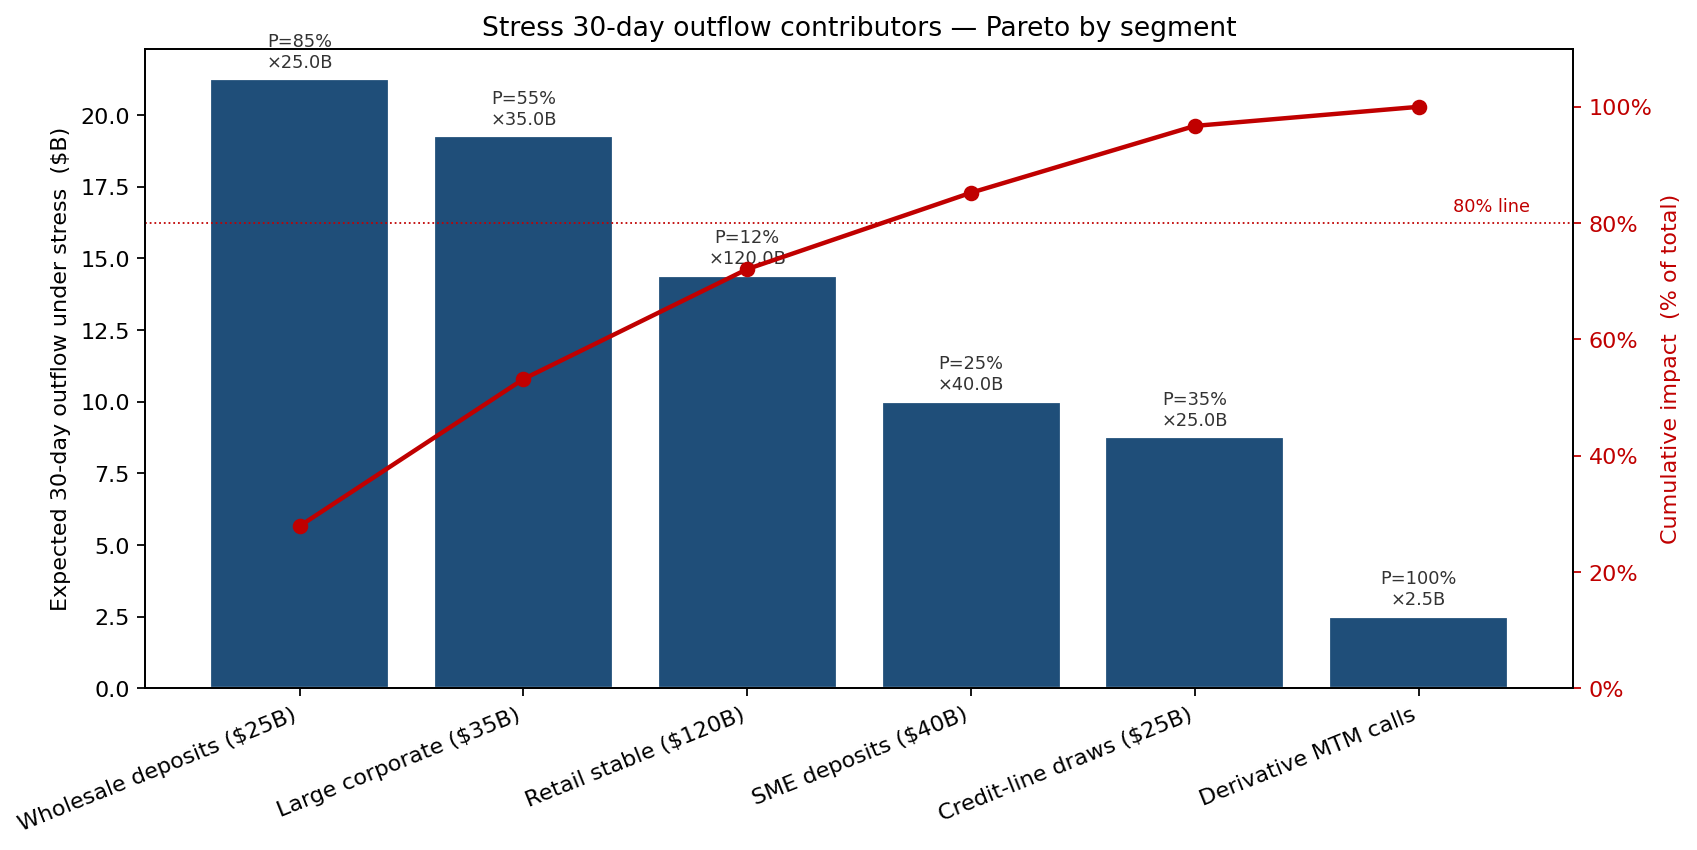
Wholesale deposits and large-corporate operational deposits together drive roughly 53% of the stress outflow despite making up only 27% of the deposit base. The reverse holds on the retail side: a $120B book contributes only about 19% of the stress outflow because the run-off rate is low even under stress. The bank's liquidity vulnerability is not its deposit base — it is the wholesale and corporate concentration. That insight is buried in the deterministic LCR because all run-off rates are pre-multiplied before aggregation; it is visible in the simulation because the model preserves each segment's contribution path-by-path.
Calibration risk, not deposit risk, dominates the tail
A tornado on the stress P10 LCR shows where the analyst-time budget should go.
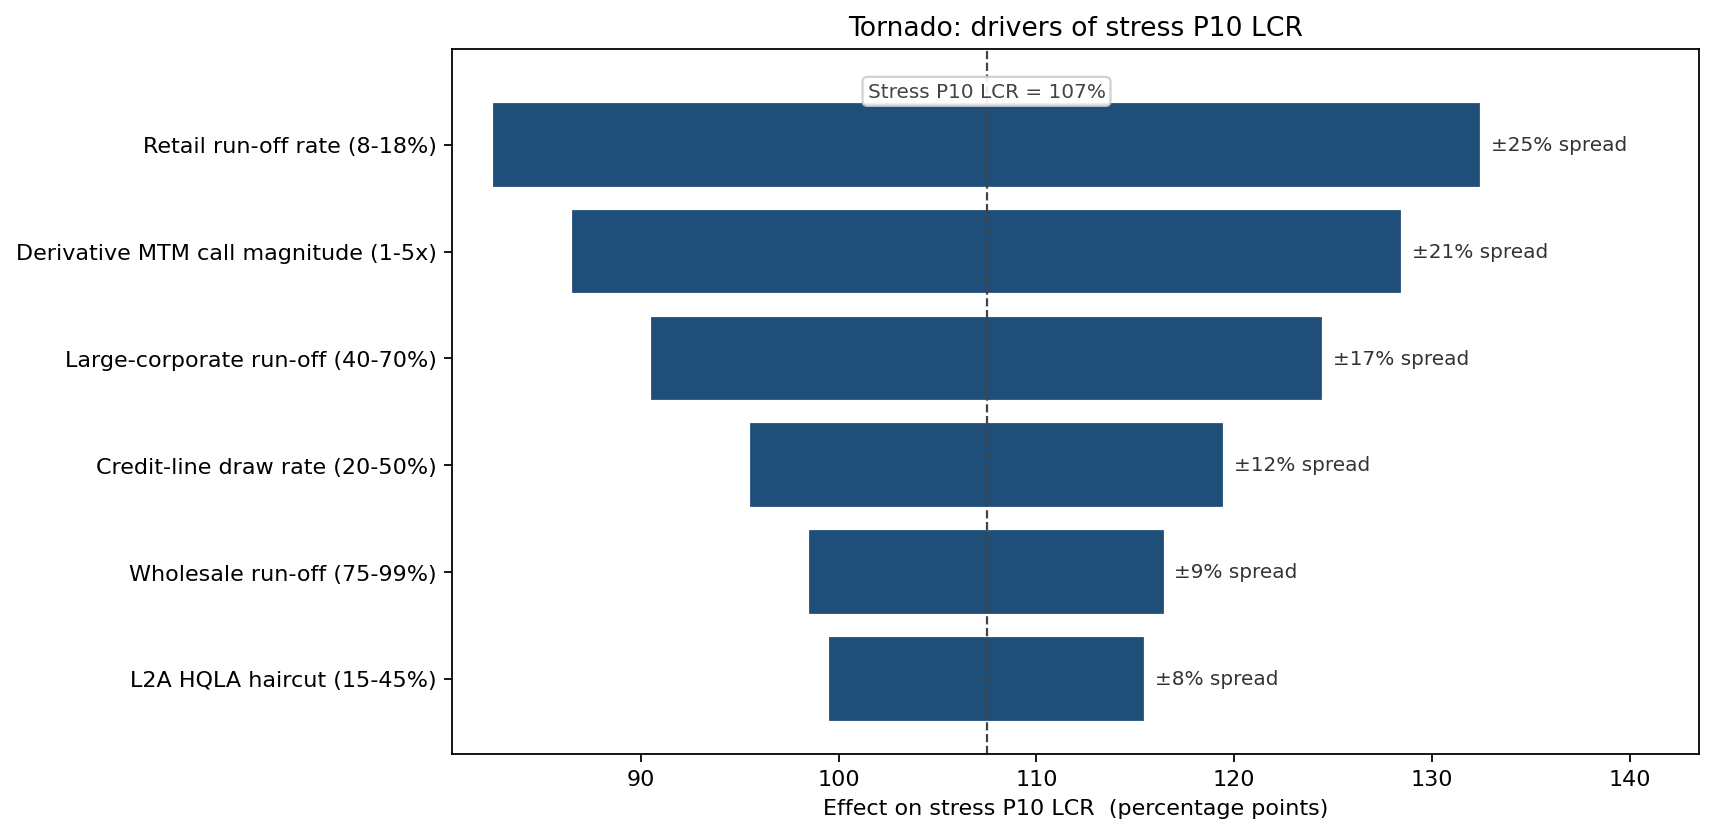
The retail run-off rate dominates, despite being the most stable segment per dollar of deposits — because the retail book is so large that a 5-point shift in the run-off rate moves the 30-day outflow by $6B, roughly the size of the entire L1 HQLA buffer's safety margin. Derivative MTM collateral calls under stress are the second-largest driver, ahead of any single deposit segment. The wholesale run-off rate, despite being the highest per dollar, is the smallest tornado contributor because its calibration uncertainty is already tight near 100%.
Buffer sizing — the question the committee actually asks
The treasury committee's binding constraint is internal, not regulatory: it requires P(stress LCR < 100%) ≤ 1%. The simulation translates that target into a dollar HQLA add.
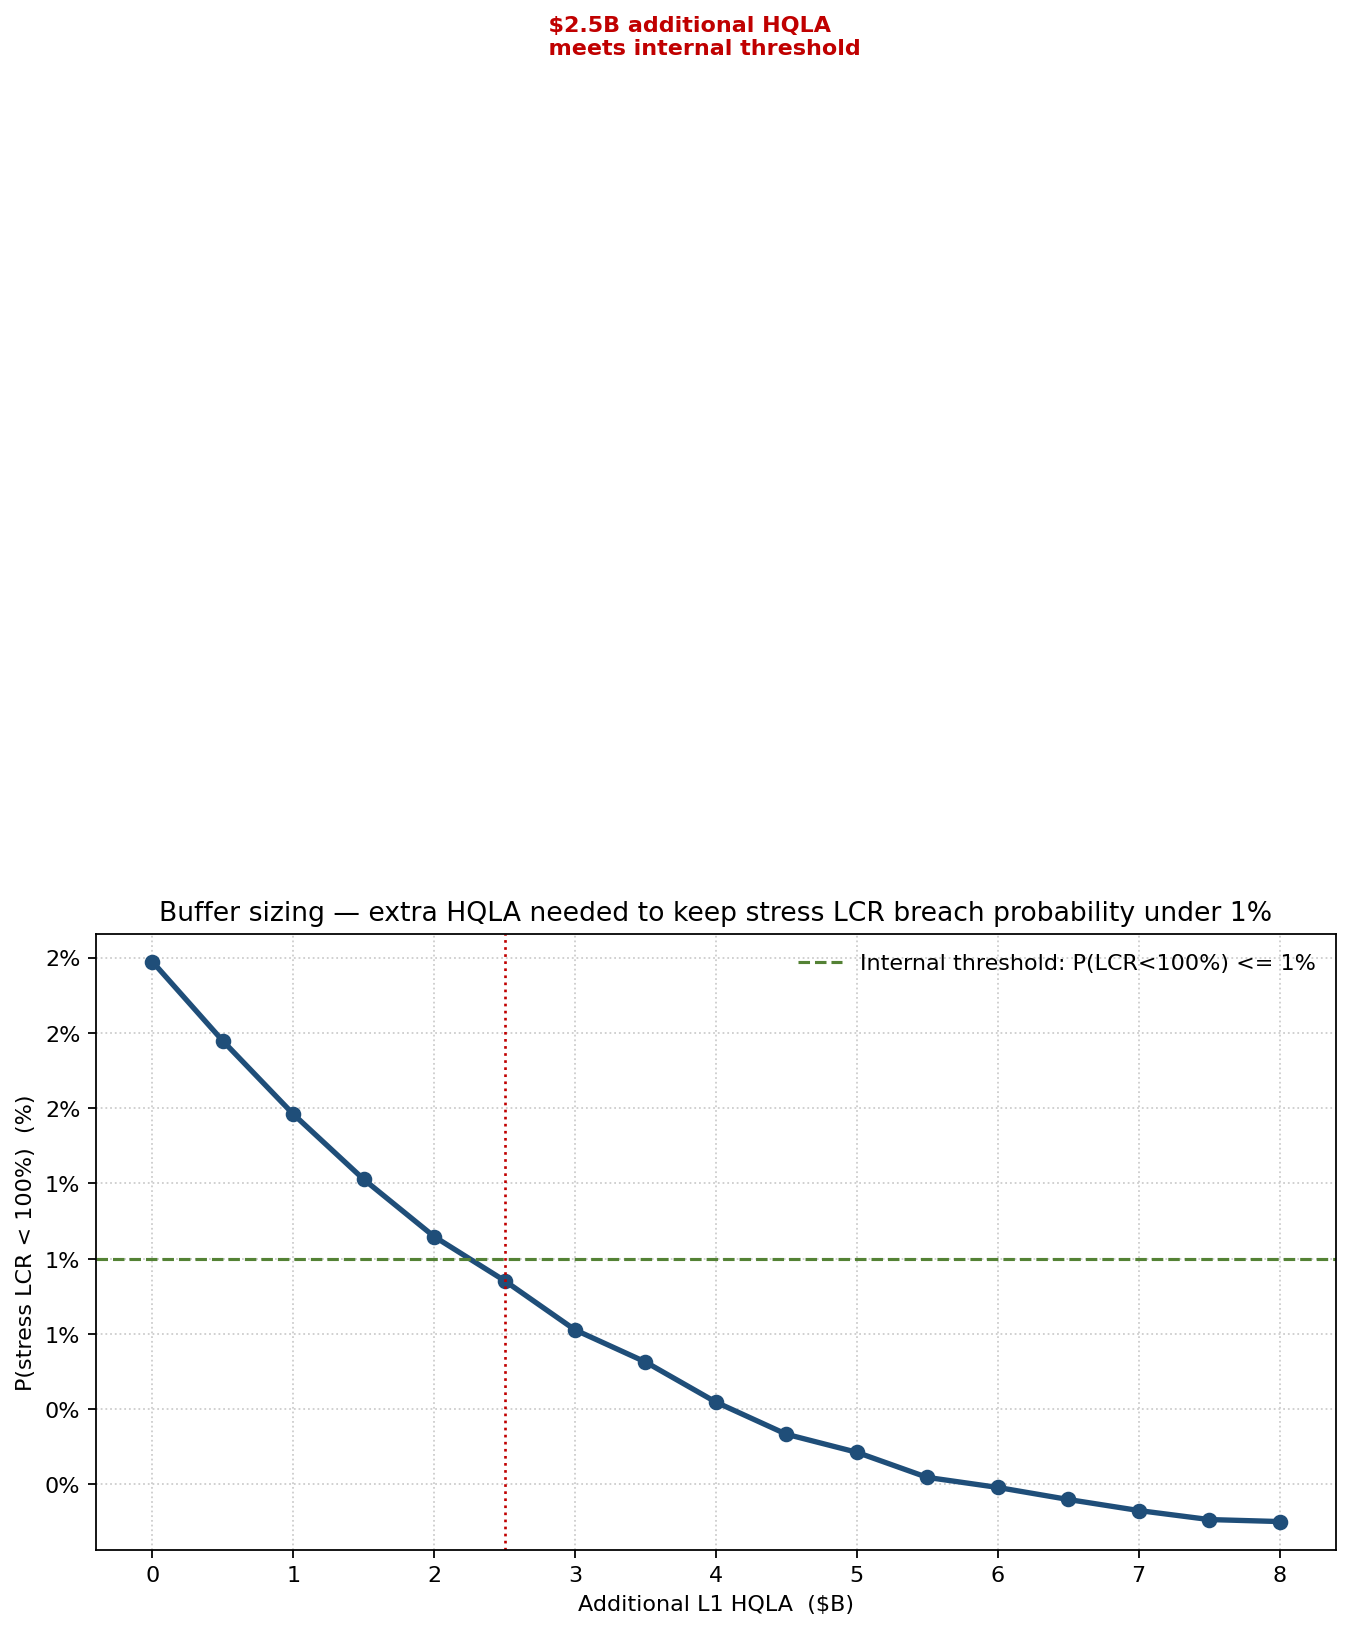
Adding L1 HQLA in $500M increments and re-running the simulation shows the breach probability falling steeply: roughly $2.5B of additional L1 HQLA brings P(stress LCR < 100%) under the 1% target. That single number — not a qualitative "hold more buffer" — is what the simulation hands the committee: the exact HQLA add that converts the bank's internal probability tolerance into a balance-sheet decision, traceable to the same stressed run-off distributions that produced it.
From insight to action
The probabilistic LCR had three operational consequences:
- Buffer sized to the probability target. The buffer-sizing curve converted the committee's "P(stress LCR < 100%) ≤ 1%" tolerance into a concrete +$2.5B of L1 HQLA — a number the deterministic LCR could never produce, because a point estimate has no breach probability to size against.
- Wholesale concentration cap. A complementary internal limit caps unsecured wholesale funding at 12% of total deposits, addressing the Pareto's structural finding that wholesale-and-corporate drive over half the stress outflow — reducing the buffer the bank must carry in the first place.
- Stress LCR reported as a distribution. Internal liquidity reports now show median / P10 / P(breach) rather than a single stress-LCR number. The ALCO meeting agenda items have shifted from "is the LCR above 100%?" to "what would move the breach probability back toward the 1% trigger?"
ModelRisk functionality used
- Beta-distributed deposit run-off by segment, calibrated so the mean matches regulatory rates and the variance widens under stress.
- LogNormal derivative collateral calls with stress-scaled mean — the only distribution that gives historical margin-call magnitudes a defensible right tail.
- 30-day LCR distribution computed path-by-path, preserving the contribution of each input rather than pre-aggregating.
- Pareto on stress outflow contributors — ranked six funding sources, exposing wholesale-and-corporate as the structural risk despite the retail-heavy mix.
- Tornado on stress P10 LCR — isolated retail run-off and derivative MTM calls as the dominant calibration risks, redirecting validation effort.
- Buffer-sizing curve — P(LCR < 100%) as a function of incremental L1 HQLA, converting the committee's probability target into a single dollar number.
Monte Carlo turns the LCR from a regulatory pass/fail into a probability of failure, and that probability is the only liquidity metric a treasurer can actually price and hedge against.