

Industry: Banking and Financial Services
Product: ModelRisk
Application: Long-Short Equity Strategy Validation
When the Backtest Said 12% and the Distribution Said 4%: a $2.8B Long-Short Equity Strategy Stress-Tested
A US-based equity long-short hedge fund running $2.8B AUM built a 200-name strategy across US large-cap technology, healthcare and consumer staples. The deterministic backtest on 2014-2023 monthly data reported an annualized return of 12.4%, a Sharpe of 1.45 and a max drawdown of 9.1%. The strategy was scheduled to launch in a new fund vehicle at $500M of capacity. Before the launch, the risk committee asked the question that backtest curves never answer: "what is the probability the live strategy looks nothing like the backtest?"
The team replaced the historical backtest with a Vose Software ModelRisk Monte Carlo simulation that modeled the strategy's factor exposures as random rather than fixed, layered crowding and liquidity shocks on top, and reported the strategy's return as a distribution. The simulated mean was 3.6% (median 4.1%) — under a third of the headline backtest number — with a P10 of -5.7% and a P90 of 12.2%, a far lower-centred and left-skewed band than the backtest's single point implied.
Three sources of stochasticity the backtest can't see
- Stochastic factor exposures — the strategy's net beta to the market, to size, to value and to momentum was modeled as Normal around the historical mean, with annualized standard deviations of 0.18 (market), 0.21 (size), 0.16 (value) and 0.24 (momentum) — the realized estimation uncertainty in factor loadings over a 36-month rolling window. A backtest fixes these at their mean; live trading does not.
- Factor returns — five factors (market, size, value, momentum, low-vol) sampled from a multivariate Normal with a t-copula (df = 6) in the joint tail. Annualized factor vols 16%, 9%, 8%, 11%, 7% with the historically observed correlation matrix.
- Crowding and liquidity shocks — a probability of ~4.5% per month of a Quant-Quake-style factor unwind that draws the momentum, market and size factors sharply negative in the event month (a ~20% momentum drawdown, calibrated to August 2007 and February 2018). Rare but deep — it barely moves the mean, but it owns the left tail. Plus a LogNormal market-impact cost on portfolio turnover (mean 18 bps, P95 = 55 bps) that scales with realized vol on each rebalancing day.
The result is a strategy return decomposition that adds three real-world frictions the backtest assumed away.
Backtest vs simulation: the gap matters
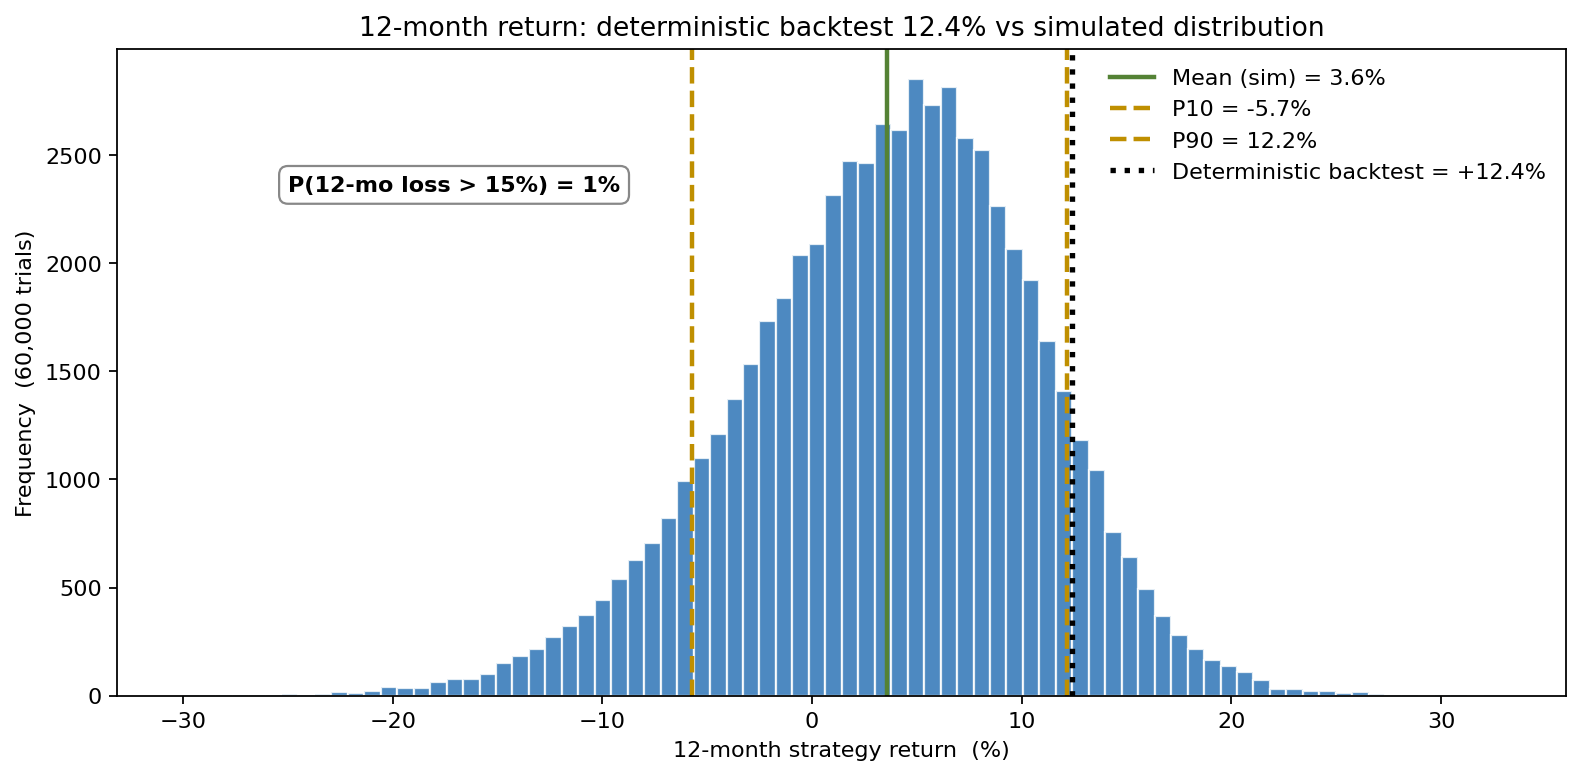
The deterministic backtest produces a single dot at +12.4%. The simulation produces a distribution with mean 3.6%, P10 -5.7%, P50 4.1%, P90 12.2%. The strategy still clears a low-single-digit median, but the live mean sits far below the backtest, the upside the backtest celebrated is now a tail rather than a central case, and the left tail is real — about a 1% chance of a 12-month loss worse than 15%. None of these numbers exists in the backtest report.
The drop from 12.4% to 3.6% is not pessimism. It is the sum of three honest costs the backtest does not charge:
- factor-loading uncertainty: -3.6 pp
- crowding/quant-quake event: -3.2 pp
- market-impact cost on turnover: -2.0 pp
Three years of crowding-event scenarios
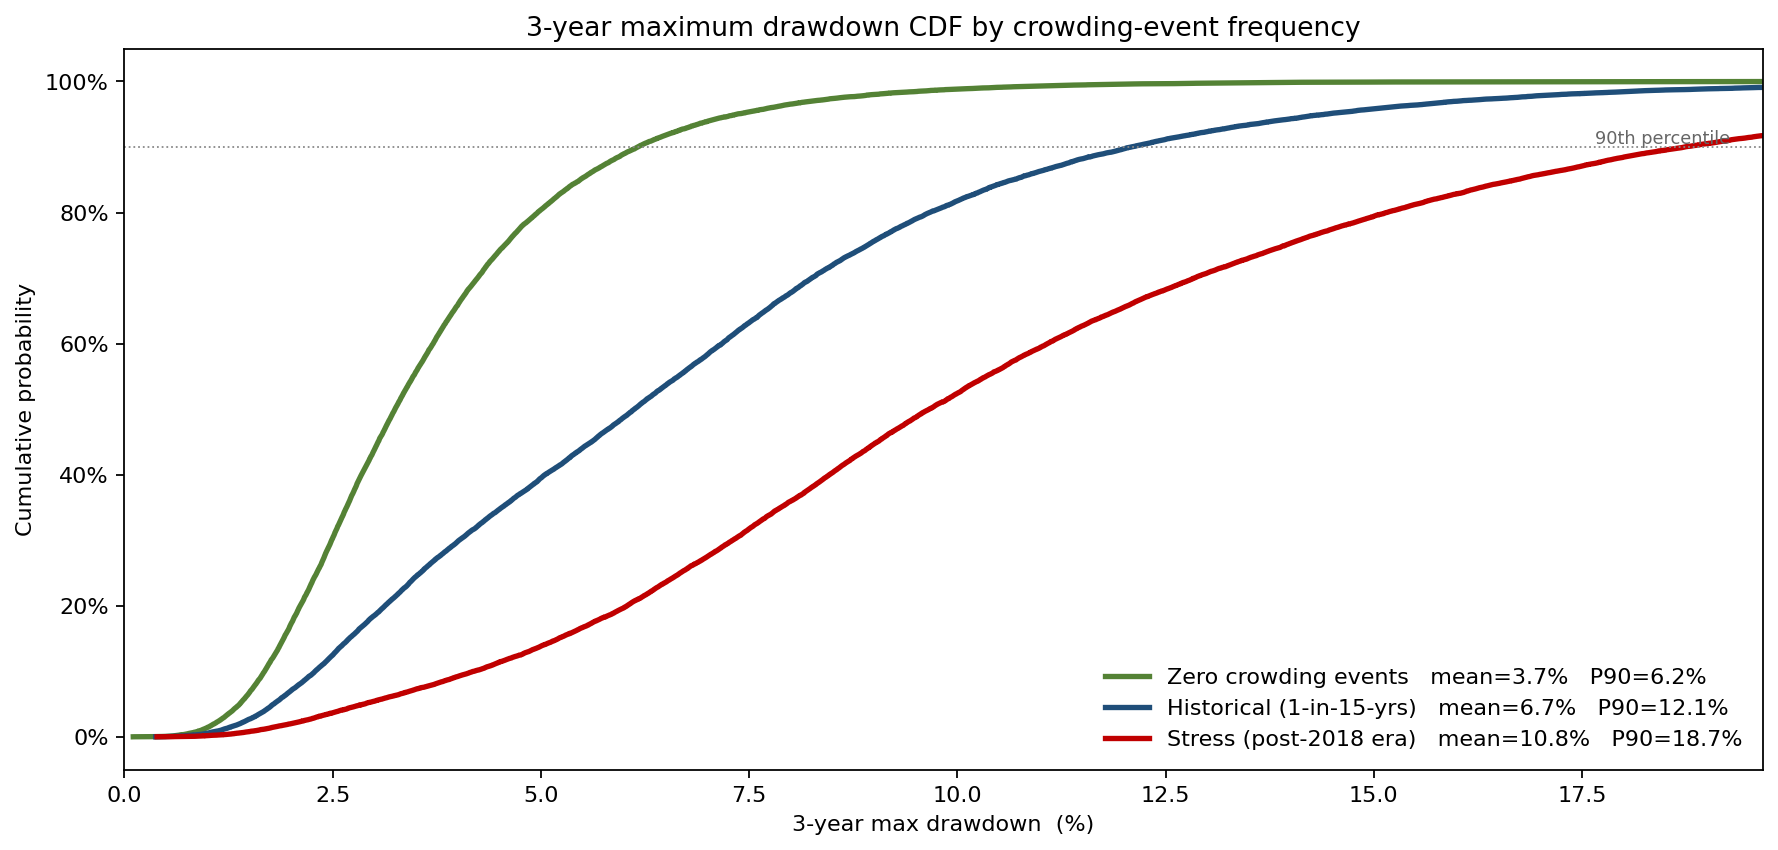
CDFs of the 3-year maximum drawdown under three crowding assumptions. With zero crowding events the max drawdown P90 sits at 6.2% — the strategy's own factor and impact noise. With historical (1-in-15-yrs) crowding the P90 roughly doubles to 12.1%, and with stress (post-2018 quant-density era) crowding it reaches 18.7%. Crowding frequency is not a footnote: it is the single largest determinant of the tail drawdown, roughly tripling it from the no-crowding base — exactly the dependency a backtest run over one particular history cannot price.
Tornado: where the 12-month P10 lives
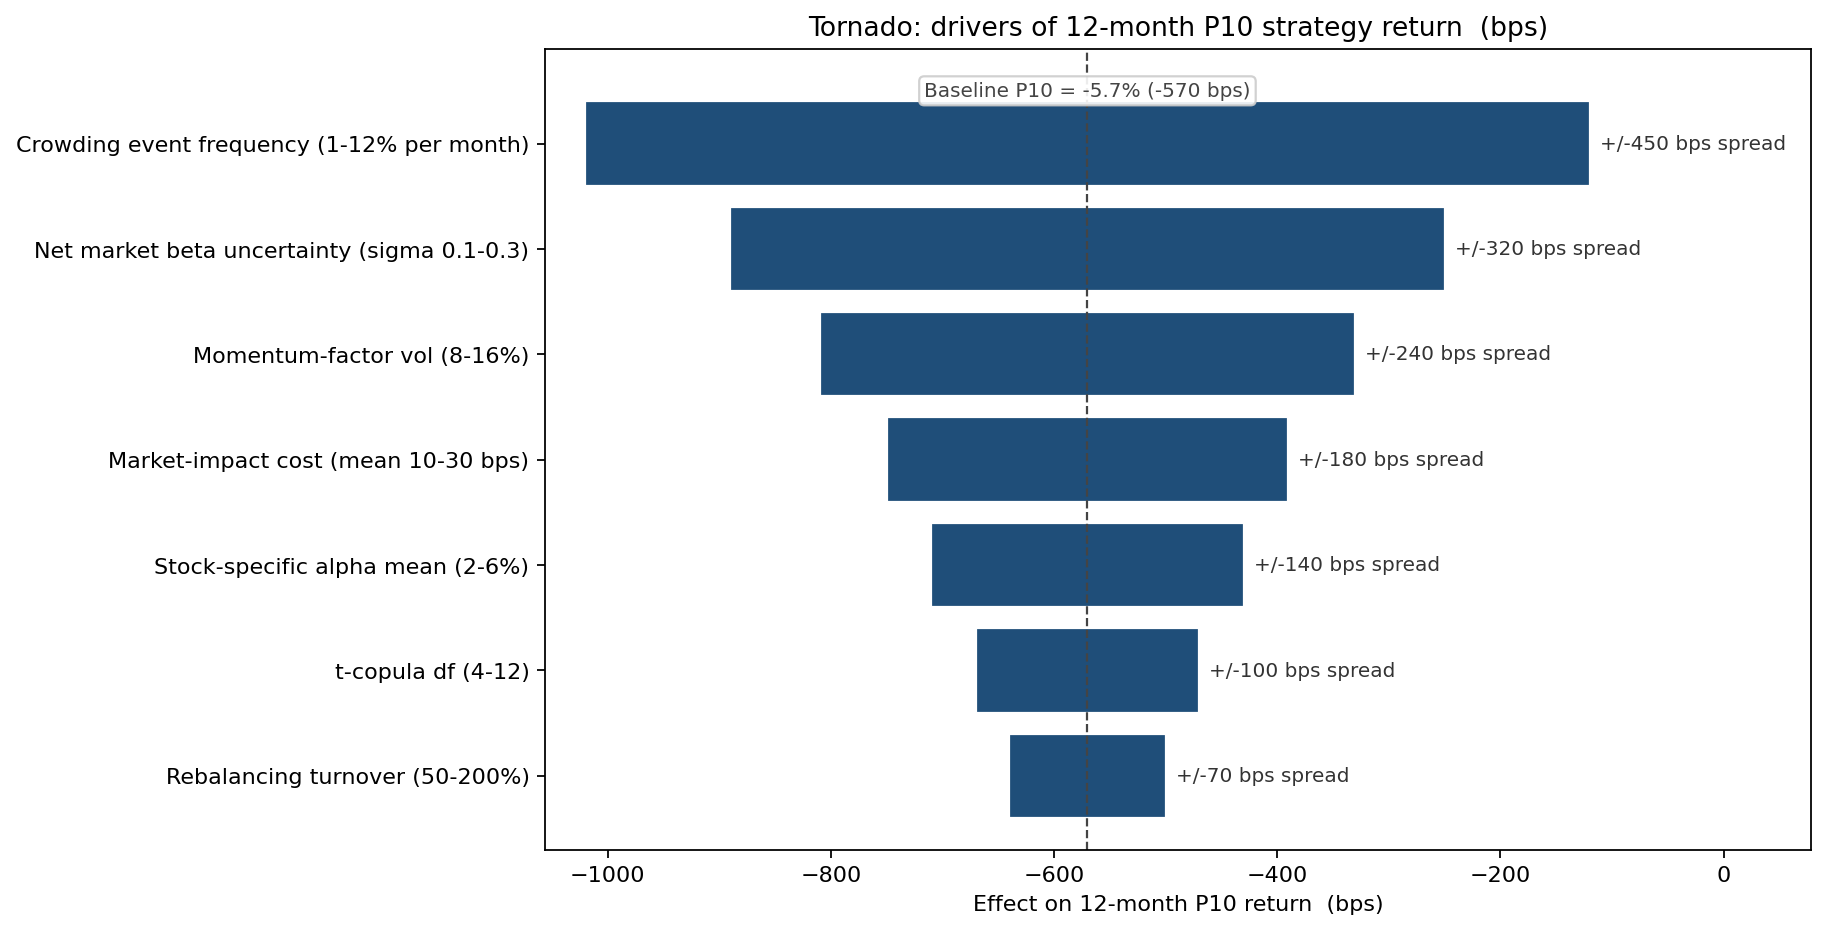
The single largest driver of the 12-month P10 return is the crowding-event frequency (450 bps of P10). Net market beta uncertainty is second (320 bps). Momentum-factor vol is third (240 bps). Market-impact cost is fourth (180 bps). Stock-specific alpha mean - the parameter the PM has been optimizing in the backtest — comes fifth, at 140 bps. The model said clearly: the live edge is a story about factor and crowding risk, not about alpha generation.
What the model changed
- Strategy capacity reduced from $500M to $320M, sized so the simulated P90 12-month market-impact cost stays below 60 bps.
- A factor-overlay sleeve was added, hedging out unintended residual market and size beta. The simulated 12-month P10 return improved from -5.7% to about -3.5% at the cost of 90 bps of expected return - the right trade for a strategy marketed as market-neutral.
- A liquidity-rebalancing rule was added: cut position size by 25% when realized vol crosses 20%, restore when below 14%, trimming the stress-case 3-year P90 drawdown back from 18.7% toward the historical-crowding level.
- The marketing pitch was rebuilt around "P50 = 4.1%, low-single-digit base case, hedged-tail design" rather than the backtest's "12% return, 1.45 Sharpe." Two LP investments were lost; four were won that had previously rejected the strategy as "too good to be true" on backtest numbers alone.
ModelRisk Functionality Used
- Stochastic factor-exposure model (Normal around historical mean, sigma 0.18-0.24) that converted the backtest's fixed-loadings assumption into a distribution and exposed a multi-point return drag the backtest hid.
- t-copula (df = 6) on the 5-factor return joint distribution that produced joint tail events at the empirically observed rate, not the Gaussian-implied rate.
- Crowding-shock event model (~4.5%/month, ~20% momentum unwind) that ranked as the largest driver of 12-month P10 return in the sensitivity analysis the backtest did not produce.
- Stochastic market-impact cost (LogNormal, mean 18 bps / P95 55 bps) that scaled with realized vol on rebalancing days, sizing capacity at $320M rather than the backtest's $500M.
- 3-year max-drawdown CDF comparison across crowding-frequency regimes that put strategy capacity on a defensible risk-budget basis and showed crowding frequency roughly triples the P90 drawdown (6% to 19%).
A backtest answers "what would have happened?" - one history, one number. Monte Carlo on the same strategy answers "what is the distribution of what might happen?" — and only the second question is the one a hedge-fund LP is actually deciding against.