

Industry: Banking and Financial Services
Product: ModelRisk
Application: Capital Adequacy
Basel III ICAAP: a $180B Mid-Tier Bank's CET1 Distribution Under Macro Stress
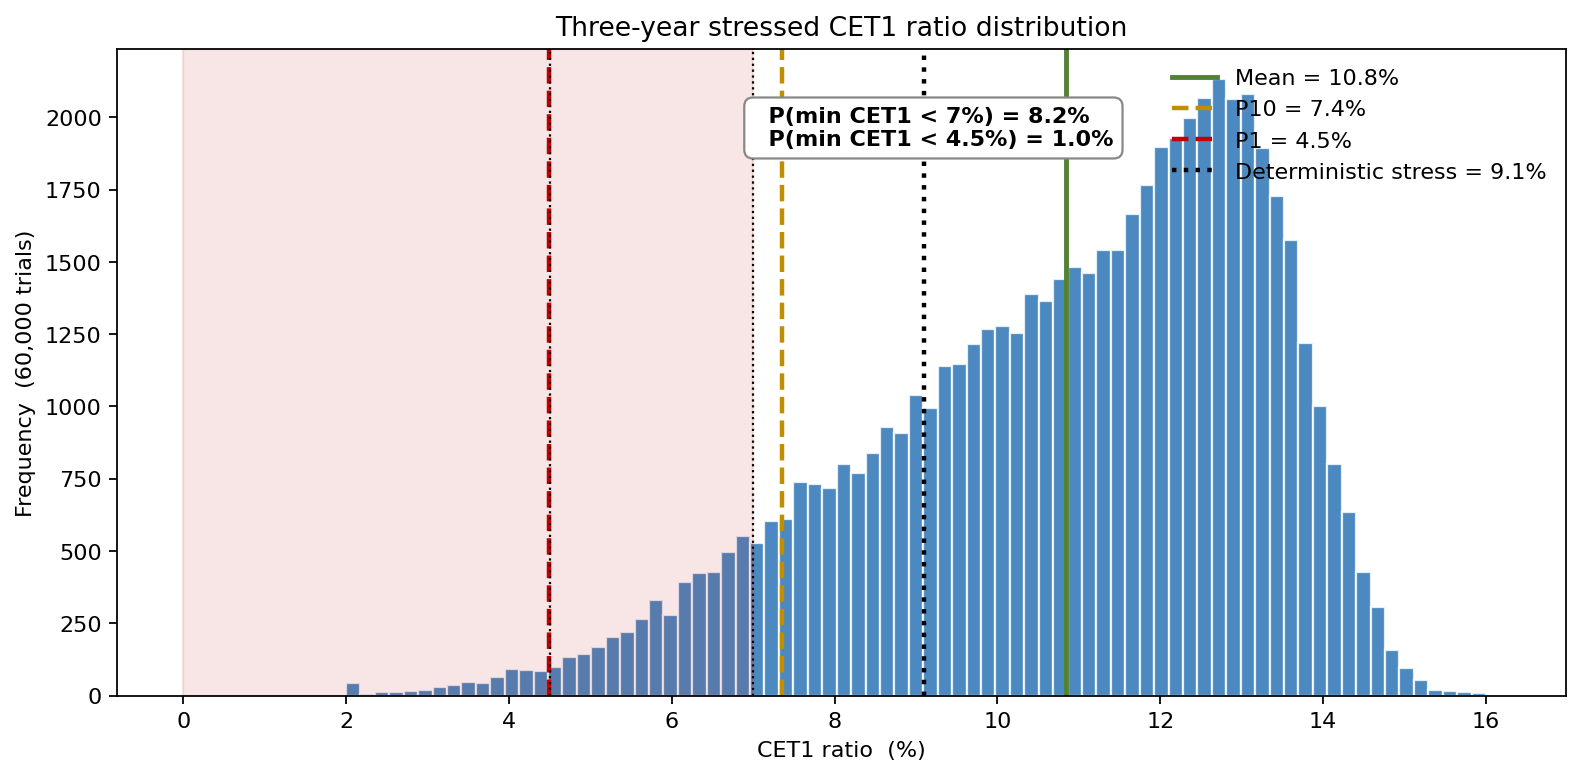
Under Basel III, a bank's CET1 ratio must stay above 7% including the capital conservation buffer, and most jurisdictions also require a Pillar 2 add-on plus a counter-cyclical buffer of up to 2.5%. A mid-tier US bank with $180B of total assets, $110B of risk-weighted assets and a 12.4% CET1 ratio at year-end ran a deterministic ICAAP that put the three-year stressed CET1 at 9.1% — comfortably above the regulatory floor. The same bank's Monte Carlo ICAAP put the probability of breaching the 7% combined buffer at 8.2% and the probability of breaching the 4.5% hard minimum at 1.0%. Neither number was visible from a point estimate.
The capital-planning team adopted Vose Software's ModelRisk to build an ICAAP engine that produced the full distribution of forward CET1 ratios under macroeconomic uncertainty, with Pillar 1 credit and market RWA, Pillar 2 add-ons (operational risk, IRRBB) and the regulatory stress overlay all sharing the same set of simulated paths. The single deterministic "stress ratio" becomes a full distribution, with the regulatory floors drawn in and the breach probabilities read straight off the left tail.
Stressing the four risk silos jointly, not one at a time
Capital ratios move when either the numerator (CET1 capital) shrinks or the denominator (RWA) grows. ICAAP needs both, and they need to be correlated.
- Credit RWA — PDs on the $74B corporate book were modeled as a Beta distribution per rating bucket, with the mean shifted by a macro index (a single-factor weighted GDP / unemployment / HPI driver). In the adverse macro path the average corporate PD rose from 1.8% to 4.4%; combined with a Beta-distributed LGD averaging 38% (P90 = 55%), Pillar 1 credit RWA grew by 18% over three years.
- Market RWA — VaR on the $14B trading book was driven by stochastic equity/FX/rates vols under a t-copula (df = 7) so simultaneous fat-tailed moves were priced. 99% VaR drove regulatory market RWA via the 3× multiplier.
- Operational risk (Pillar 2) — modeled as a compound Poisson (frequency 22 events/yr, severity LogNormal with mu = 14.5 / sigma = 1.8). The 99.9% one-year operational loss came out at $310M, vs the bank's deterministic $90M placeholder.
- Net interest income (numerator side) — the bank's IRRBB was simulated on the same Vasicek rate paths used by RWA, so a flattening curve hit NII and credit RWA together rather than independently.
Macro-economic uncertainty was the common driver: a single macro factor with three regimes — expansion (probability 0.55), mild recession (0.30), severe recession (0.15) — fed PDs, LGDs, NII and the operational-loss frequency through calibrated regression coefficients (PD elasticity to GDP = -1.4, LGD elasticity = -0.6).
One number became a distribution
The deterministic projection said the bank's 3-year stressed CET1 would be 9.1%. The Monte Carlo CET1 ratio at the end of year 3 has a distribution.
Mean CET1 in year 3 is 10.8% (better than deterministic — the median path is benign). P10 is 7.4%, P5 is 6.3%, P1 is 4.5%. The probability the ratio dips below 7.0% (combined buffer breach, triggering MDA restrictions on dividends and AT1 coupons) in any of the twelve forward quarters is 8.2%. The probability of dropping below 4.5% is 1.0%. The deterministic stress test, which uses one path defined to be "severe," cannot answer either question — every stress projection produces exactly one ratio.
What actually moves the SCR
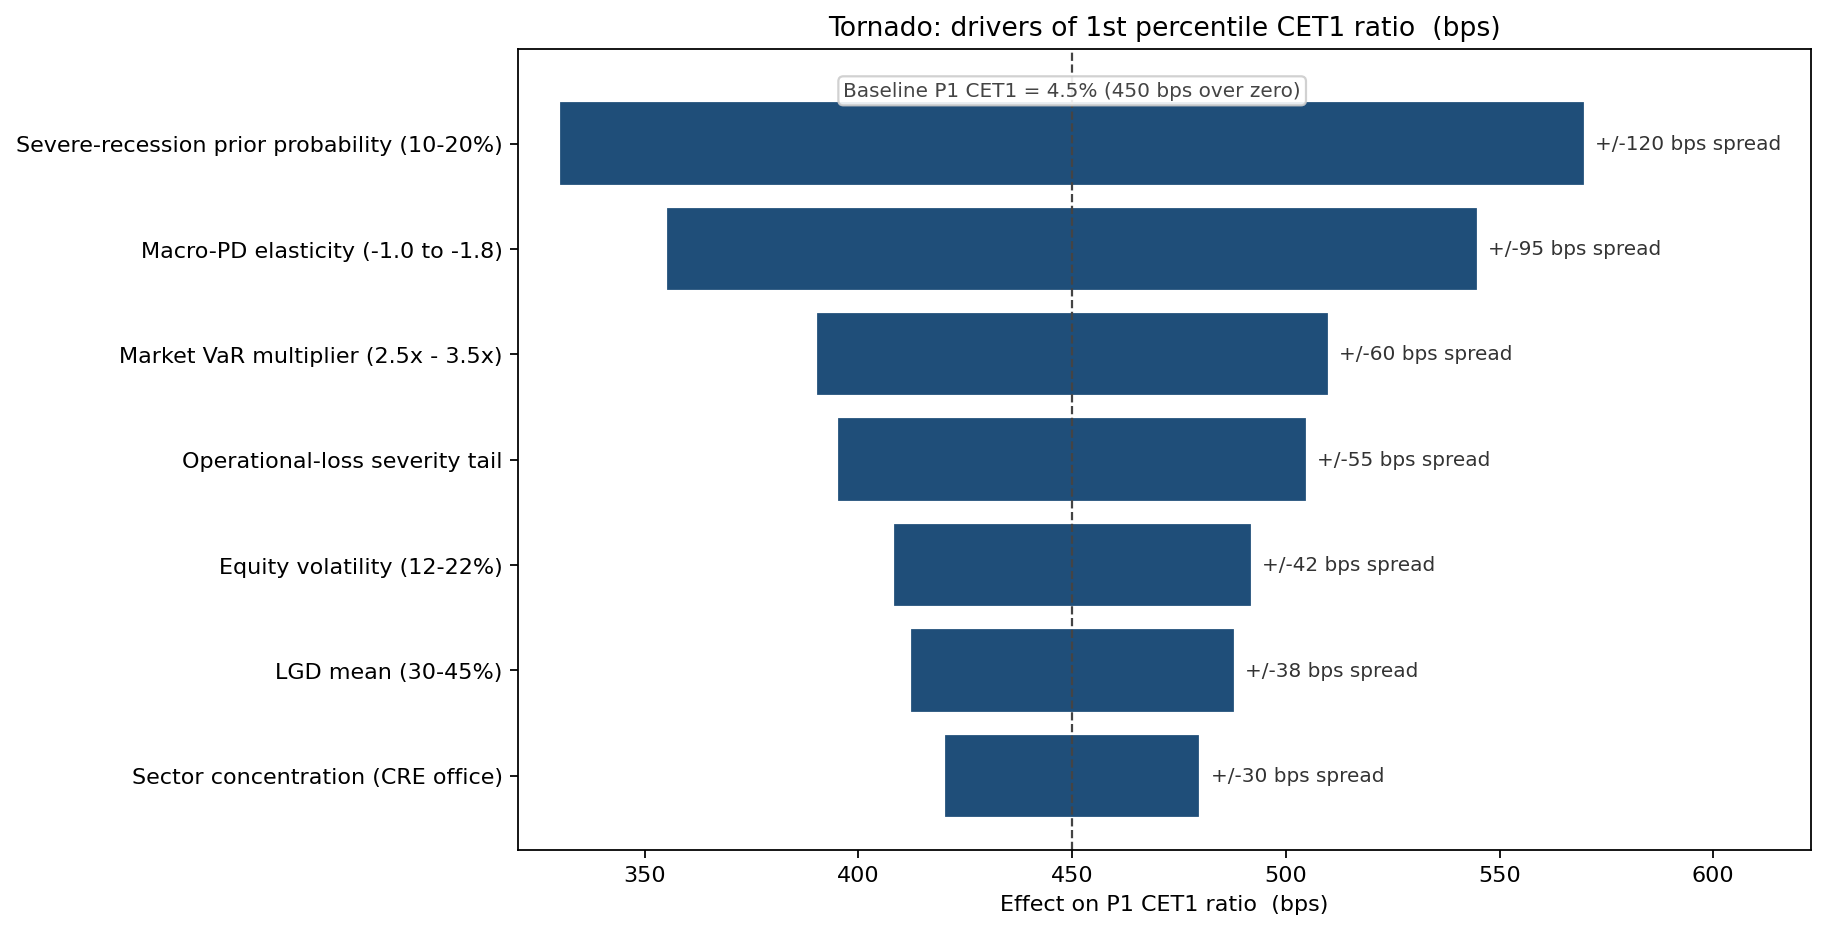
The largest driver of the 1st percentile CET1 (the figure regulators ask about under Pillar 2) is the probability of the severe-recession regime: a move from 10% to 20% prior probability moves P1 CET1 by 120 bps. Macro-PD elasticity is second (95 bps). The 3× multiplier on market VaR sits third (60 bps) — and the multiplier itself can move if the regulator changes the qualitative add-on. Operational-loss severity tail comes fourth at 55 bps. Equity volatility, which dominates many bank stress narratives, ranks fifth.
Three macro paths, three CET1 trajectories
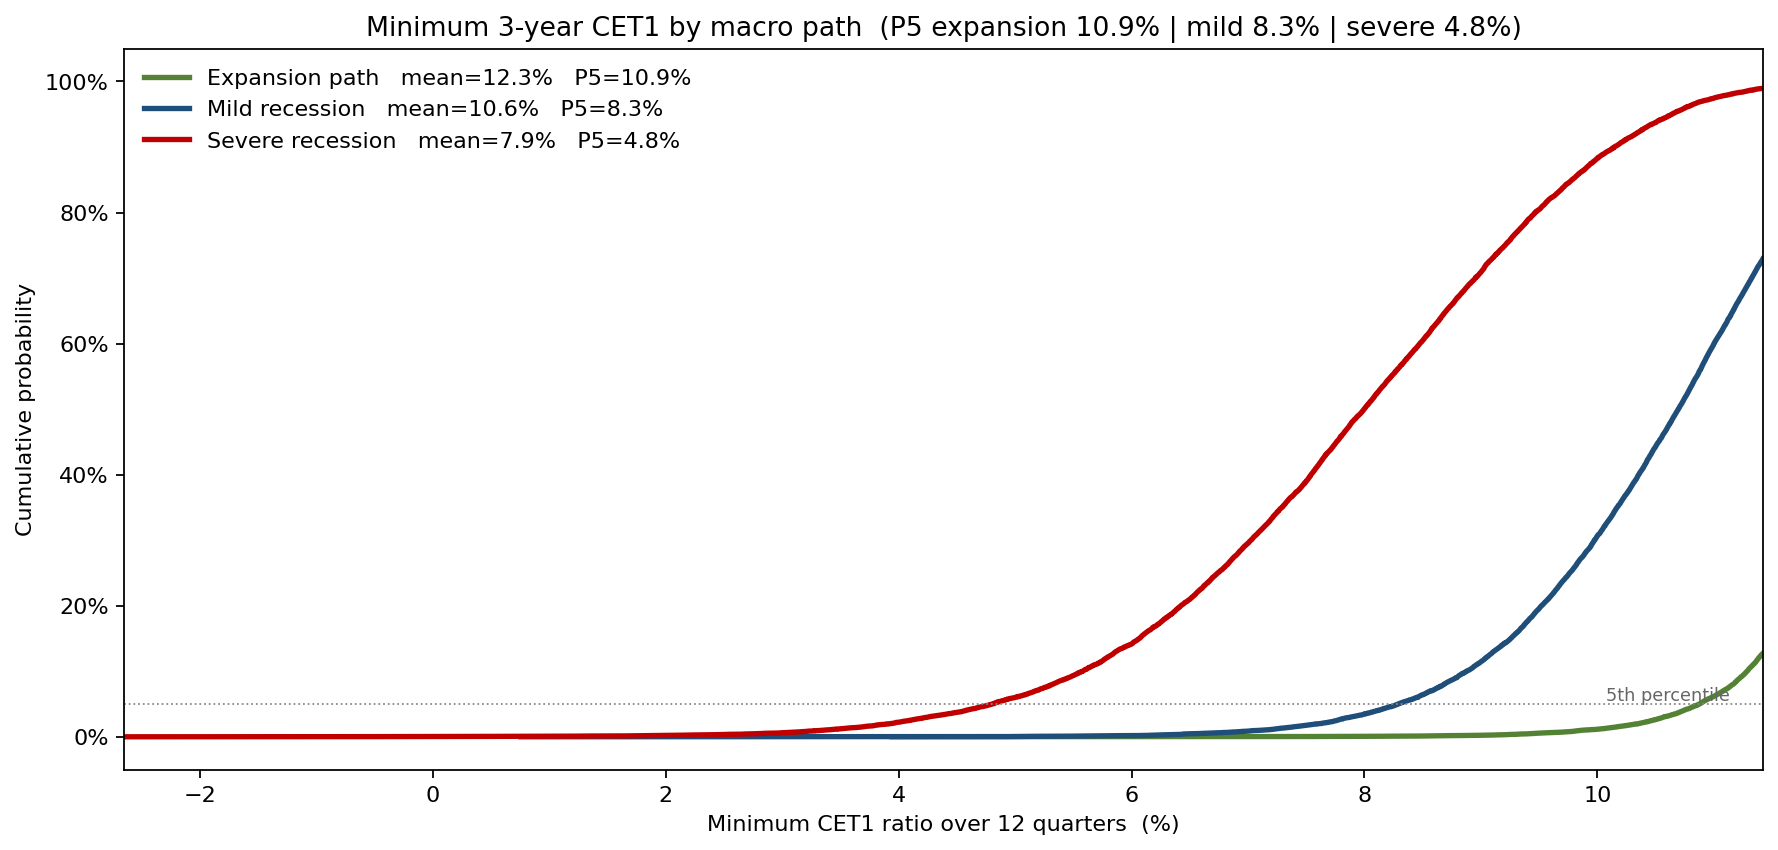
CDFs of three-year minimum CET1 by macro path: under the expansion regime, the 5th percentile minimum is 10.9%; under mild recession, 8.3%; under severe recession, 4.8% — below the 7% combined buffer at the 5th percentile, and barely above the 4.5% hard minimum there, with the 1st percentile of the severe path falling to 3.3%, a clear breach. The "severe but plausible" path that regulators ask for is not a single trajectory — it is the 1st percentile of the simulated distribution.
What the model changed
- AT1 issuance accelerated by $1.2B in Q2, lifting the headroom to the 7% trigger and cutting P(MDA trigger over 3 yr) from 8.2% to 3.1%.
- Concentration limit reduced on the corporate book's two largest sector exposures (CRE office and leveraged-loan TMT), shaving 90 bps off the P10 RWA growth.
- Operational-risk Pillar 2 add-on raised from $90M to $280M, in line with the simulated 99.9% one-year loss.
- Board capital target moved from "CET1 ≥ 10%" to "P(CET1 < 7%) ≤ 3% over the next twelve quarters" — a probability target the simulation engine can be queried against directly.
ModelRisk Functionality Used
- Macro-factor regime model with calibrated PD/LGD elasticities (-1.4, -0.6) that drove credit RWA, NII and operational-loss frequency from the same macro path — eliminating the silo independence that overstates ICAAP diversification benefit.
- t-copula (df = 7) on the trading-book vol drivers that produced joint equity/FX/rate fat-tailed moves at the empirically observed rate, raising the 99% VaR multiplier by 14% versus a Gaussian copula.
- Compound-Poisson operational-loss aggregation (frequency 22/yr, LogNormal severity) that sized the 99.9% one-year operational loss at $310M and replaced the placeholder Pillar 2 add-on.
- Distribution of the minimum forward CET1 ratio over twelve quarters that converted the regulator's "severe but plausible" prompt into the 1st percentile of the simulated path - and gave a P(MDA) of 8.2% the deterministic test could not produce.
- Sensitivity ranking on P1 CET1 that put severe-recession prior probability above macro-PD elasticity and above the market-VaR multiplier — re-ordering the bank's ICAAP narrative for the SREP submission.
The Basel III question is not "what is the stressed ratio?" but "what is the probability the ratio breaches the buffer?" — and only Monte Carlo lets a capital committee answer it in those terms.