

Industry: Banking and Financial Services
Product: ModelRisk
Application: Asset-Liability Management
Funded-Ratio Cone: ALM for a $12B Corporate Pension Under Stochastic Liabilities
A $12 billion US corporate pension closed to new entrants started 2024 at a 104% funded ratio after a decade of LDI work. The CFO wanted one number from the actuary: the probability that the plan stays above 95% funded for the next ten years. The deterministic asset-liability projection said 100% — every path hits the assumption, by construction. The Monte Carlo answer, once interest-rate, equity, longevity and inflation uncertainty were priced in, was 64%.
The plan adopted Vose Software's ModelRisk to replace the deterministic ALM projection with a probabilistic engine that produced the entire distribution of funded ratios — and showed exactly which moving parts owned the 36% probability of a breach. The output is a cone, not a line: a median funded-ratio path bracketed by the P10-P90 range and the PPA trigger levels it can cross.
The two sides of the balance sheet, both stochastic
Liabilities. The PBO (projected benefit obligation) is the present value of pension cash flows discounted at the AA-corporate curve. Three things move it stochastically:
- Discount curve — the 10-year AA yield modeled as a two-factor Vasicek process, mean-reverting to 4.6% with a short-rate vol of 110 bps/yr. A 100-bp parallel shift moves the PBO by roughly 12% (duration ≈ 12).
- CPI inflation for COLA-linked benefits — an AR(1) around a 2.3% long-run mean with annual innovation vol of 95 bps and persistence 0.55.
- Mortality improvement — annual mortality improvement scale modeled as Normal(1.1%, 0.4%) per year, with the standard deviation calibrated to the realized cross-cohort dispersion in Society of Actuaries scales. A 0.5% per-year improvement in longevity moves the PBO by ~3%.
Assets. The plan holds a 30/70 return-seeking / liability-hedging split:
- The return-seeking sleeve (global equities + private credit) is modeled as a regime-switching log-return with benign mean 7.2% / vol 13% and stress mean -4% / vol 24%.
- The liability-hedging sleeve is a long-duration corporate bond portfolio with duration 14.5, repriced under each yield-curve path so that asset and liability movements are jointly consistent — the LDI hedge is a negative correlation in the simulation, not an assumption that nets to zero in spreadsheet form.
Each Monte Carlo trial generates a coherent ten-year path: a yield curve, an equity path, an inflation path and a mortality path, all linked through a Gaussian copula with empirically calibrated rank correlations (equity returns to credit spreads at -0.45; rates to equity at +0.20 in the benign regime, -0.10 in stress).
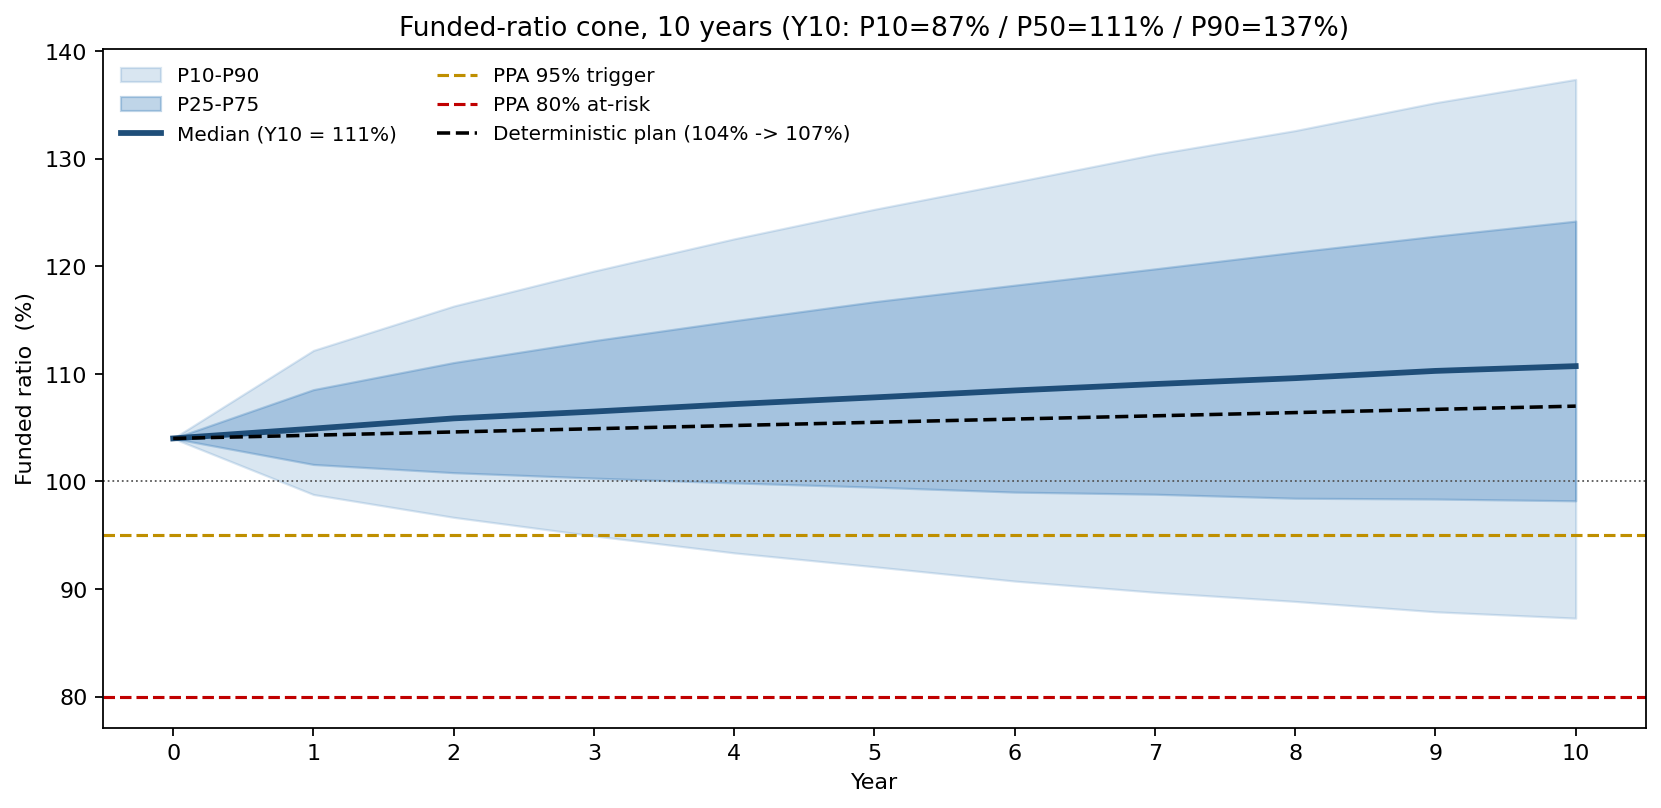
The deterministic plan said 100%. The cone said 64%.
By year 10 the funded ratio has a P10 of 87%, a P50 of 111% and a P90 of 137%. The deterministic projection sits on the P50 by construction. The probability that the funded ratio falls below 95% in any year of the ten-year window is 36%; the probability of a breach below 80% in any year — the level that triggers PPA "at-risk" status and accelerated contributions — is 6.6%.
The most important diagnostic is what kind of path produces the breach. Sorting the worst 10% of paths by their realized correlations shows two clusters: (a) a "stagflation" cluster where rates fall and equities sell off and inflation rises (liabilities up, assets down, COLAs up) — about 60% of the breach paths — and (b) a "longevity-shock" cluster where mortality improvement runs ahead of trend for six consecutive years, adding 7% to the PBO that no asset rebalancing can offset. The deterministic projection sees neither.
What actually moves the funded ratio
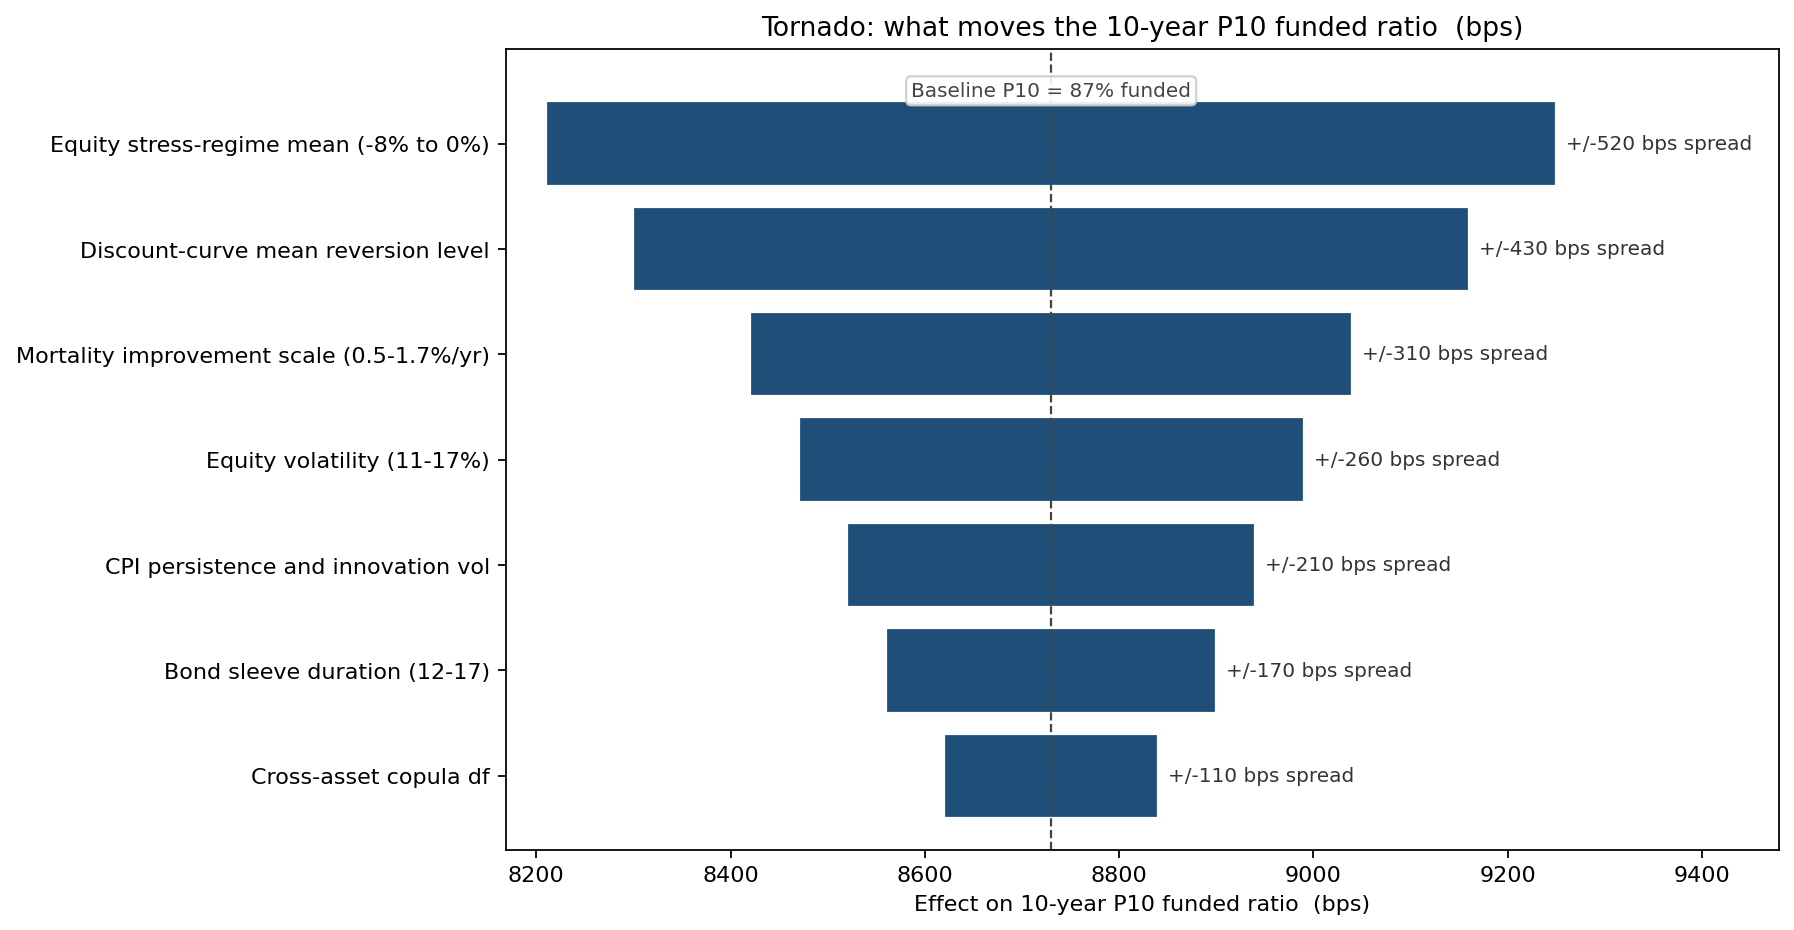
The single largest driver of the P10 funded ratio is the equity stress-regime mean (520 bps of funded ratio). Discount-curve mean reversion level is second (430 bps). Mortality improvement is third (310 bps) — larger than equity volatility, which sits fourth. The model rebalanced the team's analysis time: longevity hedging had been a "watch item"; the tornado moved it to a primary workstream.
Three contribution policies
Holding strategic asset weights constant, the team tested three contribution rules.
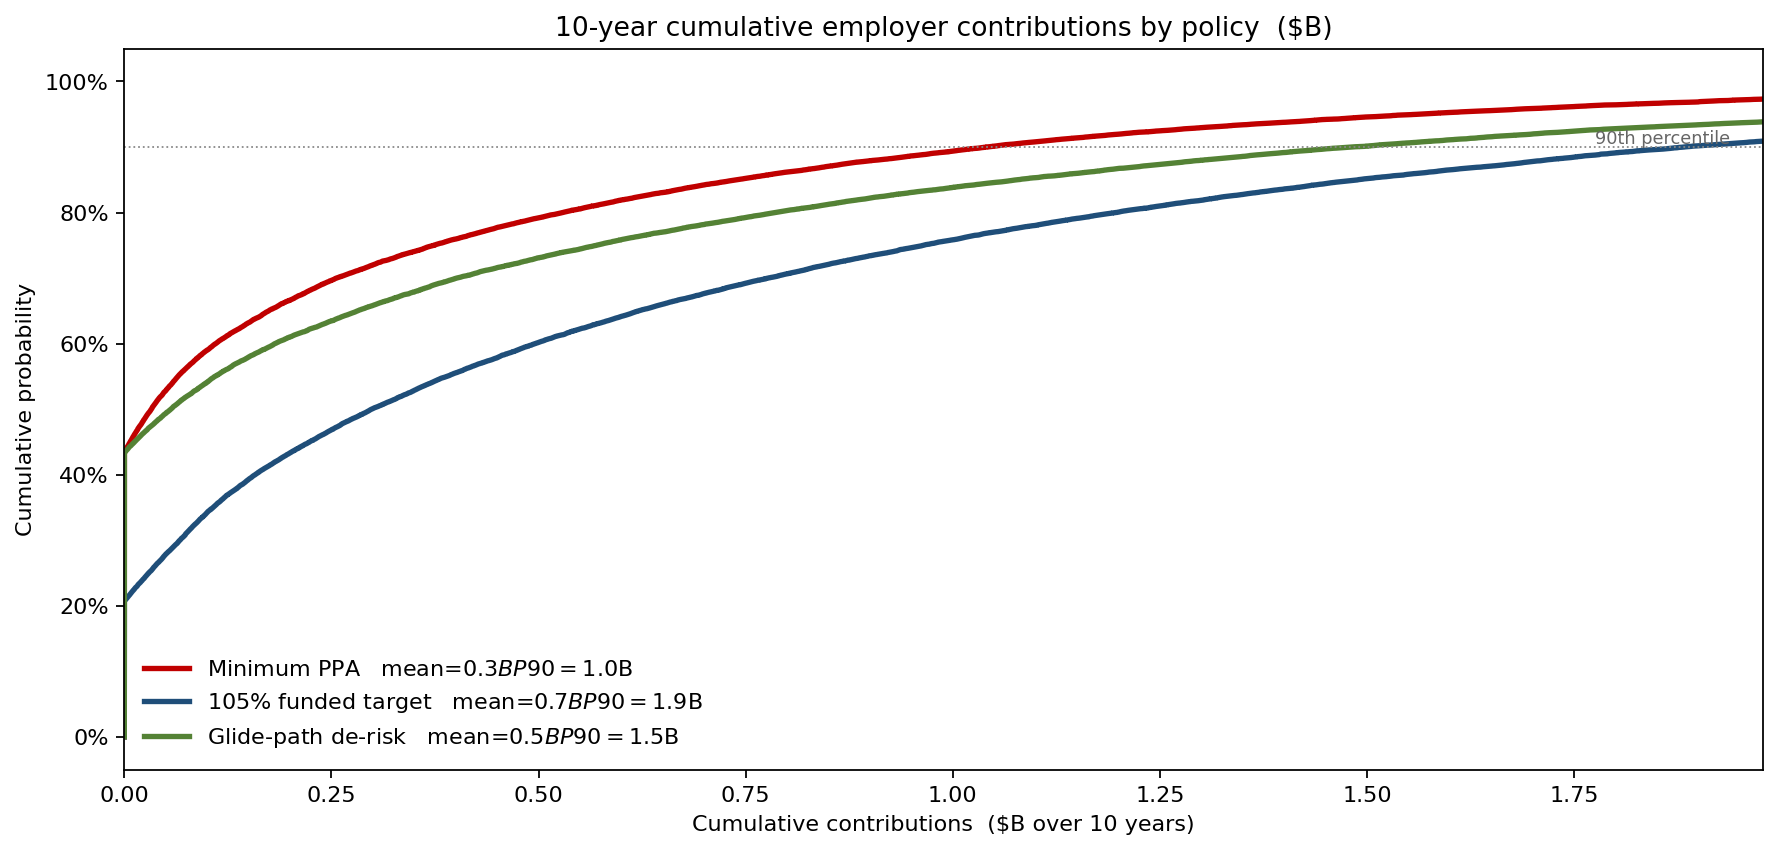
A minimum-PPA policy (amortize any below-100% shortfall over seven years) has the lowest expected ten-year cumulative contribution at $0.3B, with a P90 of $1.0B — but it leaves the funded-ratio risk on the table, contributing nothing on the median path. A funded-ratio target of 105% contributes more — a mean of $0.7B and a P90 of $1.9B — buying down the breach probability proactively. A glide-path de-risking rule (cut equities by 5 pp every time the funded ratio crosses a 5-pp threshold up) sits between them, with a mean of $0.5B and a P90 of $1.5B. The deterministic plan picked policy 1 on the grounds that its expected cost was lowest; the simulation showed that the saving comes at the price of an unhedged left tail in the funded ratio, not a cheaper outcome overall.
What the model changed
- LHL sleeve raised from 70% to 76% of the portfolio, increasing the asset-side duration hedge from 12.4 to 13.9 years and cutting P(funded ratio < 95%) materially.
- A $400M longevity-reinsurance transaction for the retired-life segment, sized to absorb the worst 5% of mortality paths.
- Contribution policy switched to the 105% funded-ratio target, raising the expected ten-year contribution to about $0.7B to buy down the breach probability instead of deferring it.
- Board reporting moved from "the plan is fully funded" to "the plan has a 64% probability of staying above 95% over ten years, and a 6.6% probability of touching the 80% at-risk trigger in some year."
ModelRisk Functionality Used
- Two-factor Vasicek term structure with 110 bp/yr short-rate vol that revalued both the bond sleeve and the discount-curve PBO on the same path — the LDI hedge as a derived output, not an assumption.
- Regime-switching equity returns that produced the stagflation cluster which dominates the funded-ratio breach probability.
- Stochastic mortality improvement that surfaced longevity as the third-largest driver of the 10-year P10 funded ratio — ahead of equity vol.
- Gaussian copula with regime-dependent rank correlations that linked rates, equities and credit spreads with the empirically observed pattern (equity-credit -0.45, rates-equity flipping sign across regimes).
- Contribution-policy comparison that showed minimum-PPA had the lowest expected 10-yr cumulative employer contribution ($0.3B, P90 $1.0B) but left the funded-ratio risk unhedged, while the 105% target contributed more ($0.7B mean, P90 $1.9B) to buy the breach probability down.
A funded ratio is a ratio of two random variables, and Monte Carlo is the only honest way to read it: ALM is the joint distribution of assets and liabilities, not the difference of two averages.