

Industry: Agriculture and Food Supply Chain
Product: ModelRisk
Application: Modeling pest resistance and its impact on crop yields
An 8-Season Pesticide With an 81% Chance of Failing Inside the 10-Year Plan
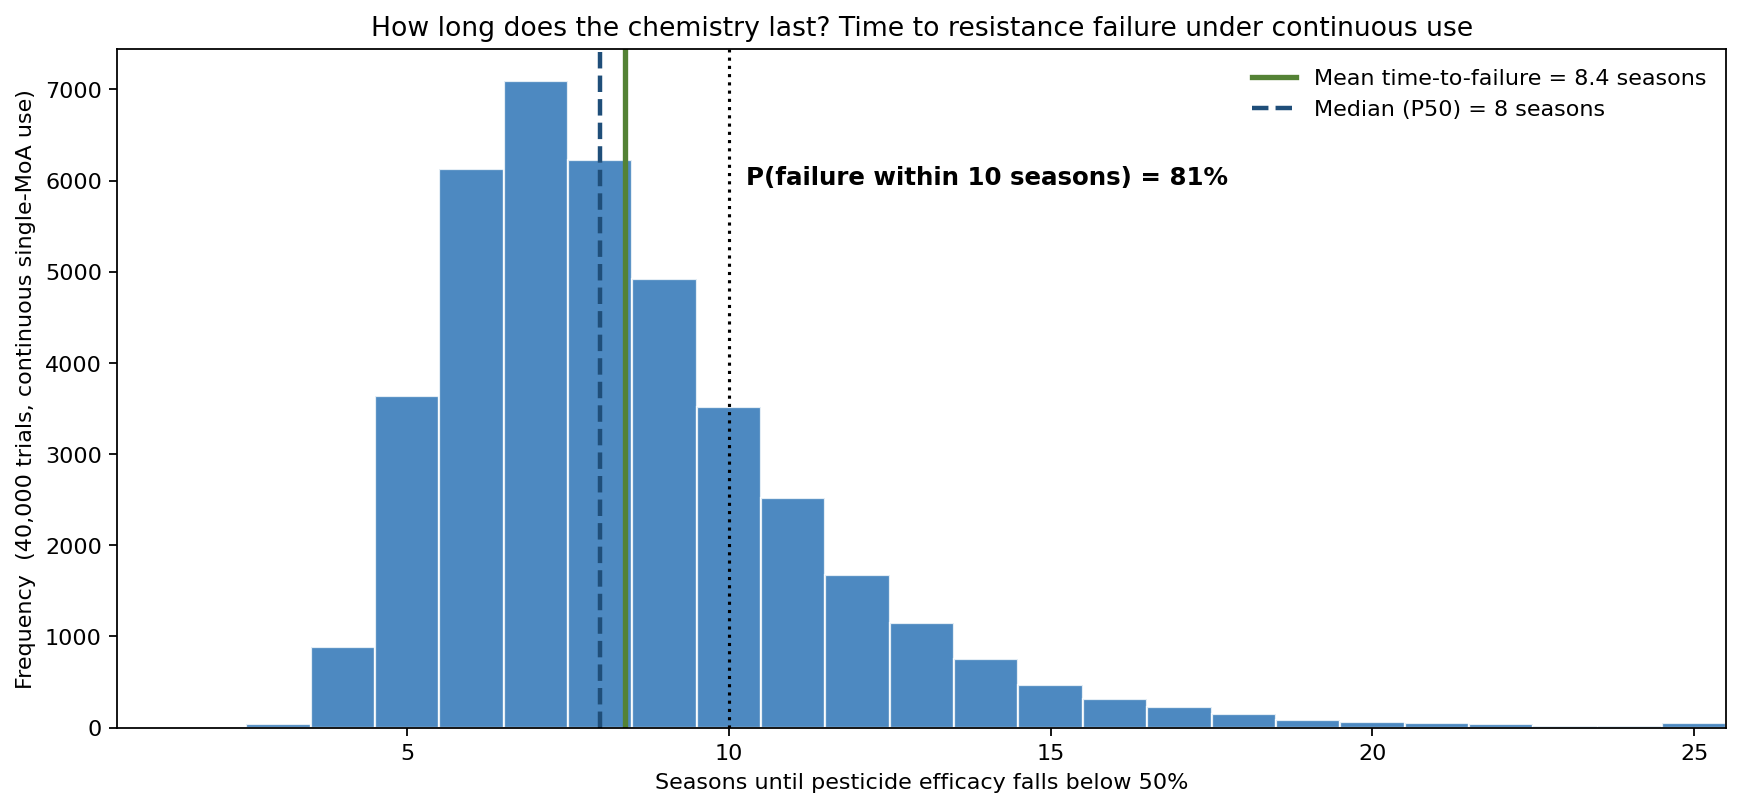
A new pesticide mode of action does not last forever — every season it is sprayed, it selects for the resistant pests that survive it, and the resistant fraction of the population climbs. Eventually field efficacy falls below the point where the chemistry is worth applying, and the active ingredient is, commercially, dead. The question an agribusiness has to answer is not whether that happens but when — and "when" is not a date, it is a distribution. Simulating continuous single-mode use 40,000 times, the chemistry lasts a median of 8 seasons before efficacy drops under 50%, but the spread runs from a P10 of 5 seasons to a P90 of 12. Most damningly for a business planning on a 10-year horizon, there is an 81% probability the product fails inside that horizon — the resistance sweep is faster than the investment payback period in four cases out of five.
The company used Vose Software's ModelRisk to model resistance as a multi-season evolutionary process, to turn "usable life" into a survival distribution, and to price exactly how many extra usable seasons mode-of-action rotation and refuge strategies buy.
Why a point estimate fails here
The traditional approach reports a single "expected useful life" — say, eight seasons — and a stewardship plan is built as if the eighth season were a reliable expiry date. It is not. The timing of resistance failure is governed by genetics that vary enormously between fields and years: the initial frequency of resistance alleles, the strength of selection each spray applies, and the fitness cost that resistant pests pay when the chemistry is absent. A single trial that draws a high starting allele frequency and a strong selection coefficient is condemned from the outset — and because those parameters persist across every season of that trial's path, the bad outcomes do not average away. They compound. The result is a right-skewed time-to-event distribution, not a point.
The chart above shows it directly. The mass piles up around the 8-season median, but the left tail reaches failures as early as the fifth season and the right tail stretches past fifteen. Planning on the mean (8.4 seasons) silently accepts that roughly half of all realizations fail sooner — and the dotted 10-season line shows that 81% fail within the planning horizon, a fact no single-number estimate would ever surface.
Modeling resistance as an evolutionary sweep
Each season the resistant allele frequency f is advanced by a logistic selection step. Resistant individuals enjoy a survival advantage (1 + s) when the chemistry is sprayed, while a fitness cost c slows the sweep when it is not. The model draws each trial's genetics once and holds them across all 25 simulated seasons:
- Initial allele frequency
f0— Beta, mean ~0.5%, capturing how rare resistance is at launch. - Selection coefficient
s— LogNormal, mean ~1.25, the survival edge a spray hands the resistant fraction. - Fitness cost
c— Beta, mean ~4%, the reproductive penalty resistant pests pay off-spray.
Field efficacy is the maximum achievable knockdown (92% against a fully susceptible population) scaled by the surviving susceptible fraction, EFF_MAX x (1 - f). The chemistry is declared failed the first season efficacy drops below 50% — equivalently, once the population is roughly 46% resistant. Because f evolves multiplicatively and the genetics are shared across a trial's seasons, the model produces a genuinely skewed survival distribution rather than a symmetric band around a mean.
How the resistance sweep actually unfolds
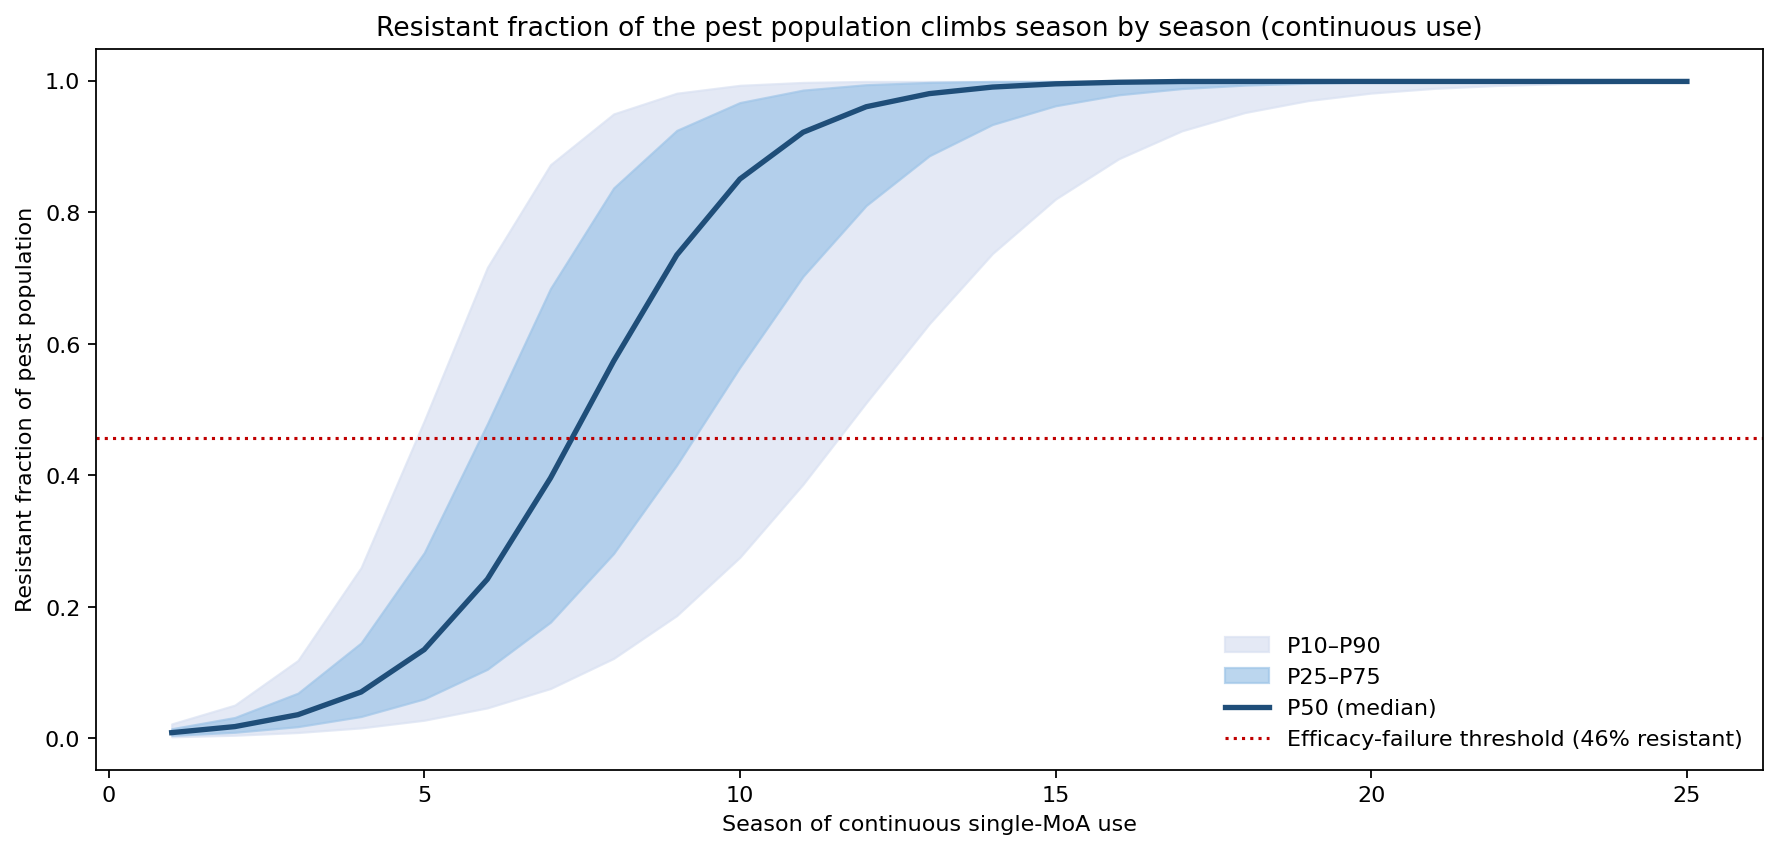
The fan chart shows the resistant fraction climbing under continuous use, with the P10–P90 band widening as the logistic sweep accelerates. By season 10 the median population is already 85% resistant — well past the 46% failure threshold — with a P10–P90 spread from 28% to 99%. By season 20 every percentile has saturated above 98%. The shape is the signature of an exponential-then-saturating evolutionary process: deceptively quiet in the early seasons, then a near-vertical collapse in efficacy once the resistant fraction gains a foothold. A grower watching only the first three or four seasons sees a product that "still works fine" — right up until it abruptly doesn't.
What rotation and refuge buy: the survival curves
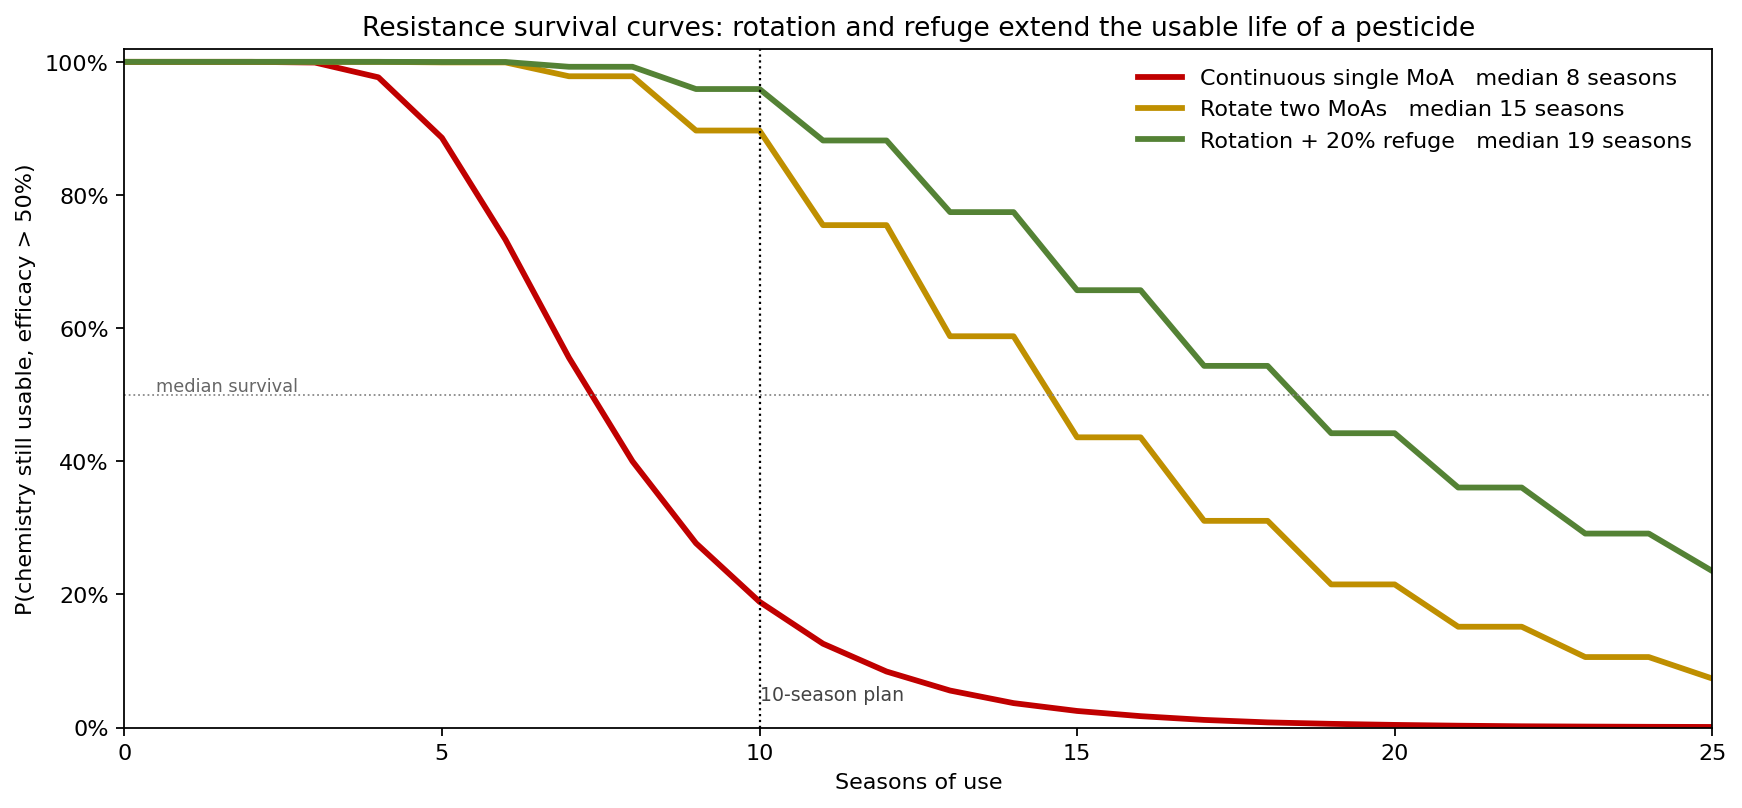
The survival curve — the probability the chemistry is still usable as a function of seasons elapsed — is the natural way to compare stewardship strategies, and it makes their value unmistakable:
- Continuous single mode of action — median usable life 8 seasons. By season 10 only 19% of trials are still usable; by season 15, 2%.
- Rotating two modes of action (selection applied only every other season) — median 15 seasons. At season 10, 90% are still usable, and 44% survive to season 15.
- Rotation plus a 20% untreated refuge (susceptible immigrants dilute the resistant fraction) — median 19 seasons, with 96% usable at season 10 and 66% at season 15.
Rotation roughly doubles the median usable life, from 8 to 15 seasons, simply by halving how often the chemistry selects on its own resistance allele. Adding a refuge extends it further to 19 seasons and lifts the share of products that survive the full 25-season simulation from essentially zero under continuous use to 23.5%. The vertical gap between the curves at the 10-season planning line is the probability-of-survival the company buys per stewardship dollar — and it is enormous.
What drives the timing
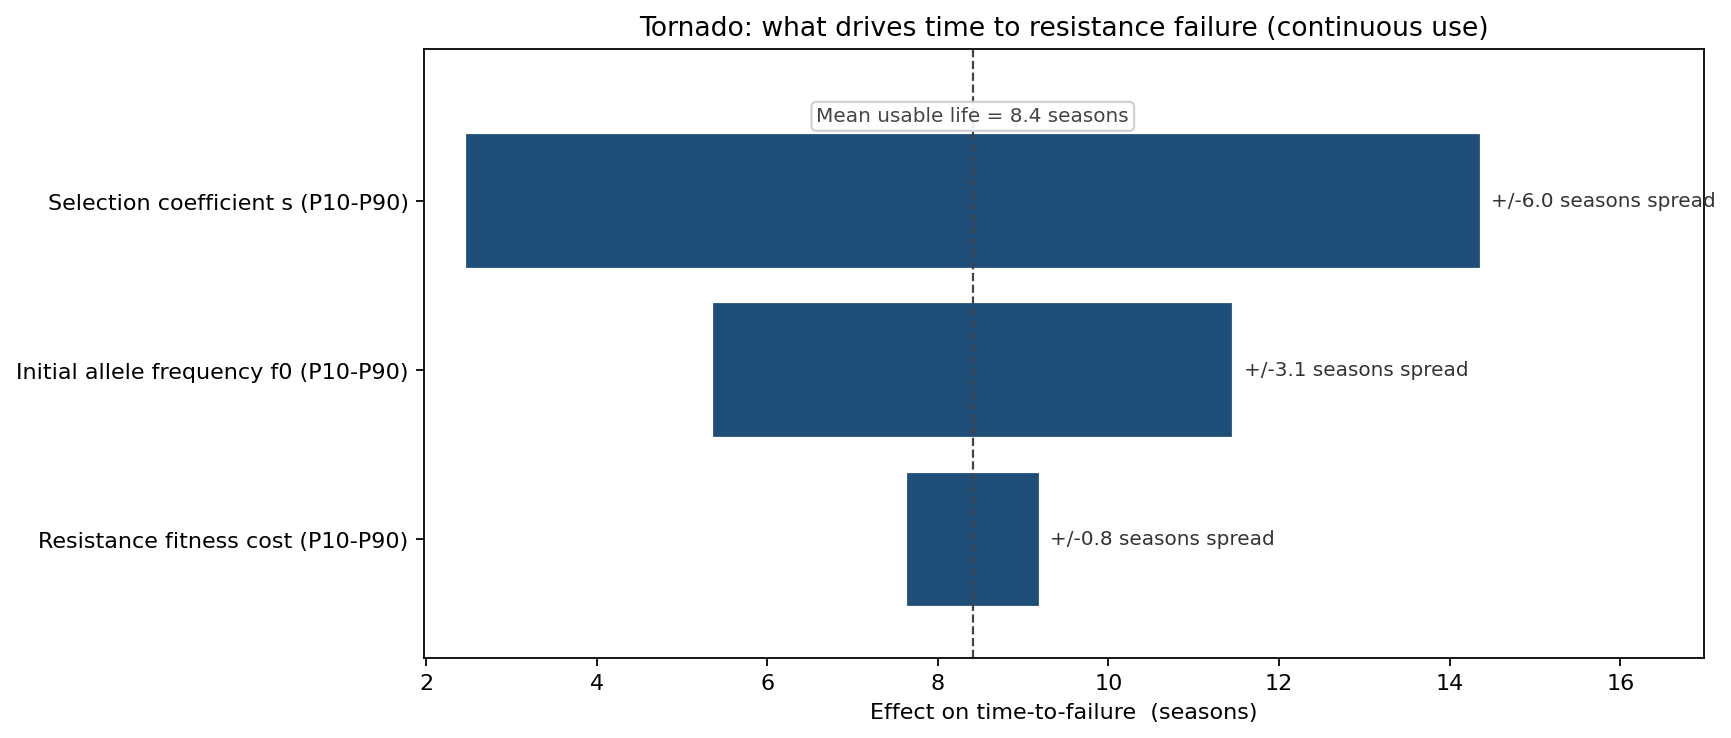
Swinging each genetic driver from its P10 to its P90 with the others held central, the selection coefficient s dominates with a +/-3.0-season swing in usable life, more than double the effect of the initial allele frequency (+/-1.5 seasons). The fitness cost of resistance is a minor lever (+/-0.4 seasons). The message is direct: the one variable that matters most — how hard each spray selects for resistance — is also the one rotation and refuge act on. Stewardship works not by changing the pest's biology but by reducing the frequency of selection, which is exactly the dominant driver the tornado identifies.
What the model changed
- The stewardship label was rewritten around survival, not a single expiry season. The product was launched with a mandatory two-mode rotation requirement, because the model showed continuous use had an 81% chance of failing inside the 10-year commercial horizon versus roughly 10% under rotation.
- A refuge requirement was added for high-pressure regions. The extra 4 seasons of median life and the jump to 23.5% long-term survival justified the yield foregone on the untreated refuge acreage.
- Resistance monitoring was front-loaded. Because the sweep is quiet then sudden — 85% resistant by season 10 under continuous use — the company shifted allele-frequency surveillance to the early seasons, when intervention can still change the trajectory.
- R&D pipeline timing was re-based on the distribution. Rather than scheduling the successor chemistry against an 8-season point estimate, the pipeline was timed against the P10 (5 seasons) to ensure a replacement existed before early-failing regions ran out of options.
ModelRisk Functionality Used
- Monte Carlo simulation of 40,000 multi-season resistance trajectories, each advancing the resistant allele frequency by a logistic selection sweep.
- Time-to-event / survival modeling turning "usable life" into a full distribution and survival curve rather than a single expiry season.
- Distribution fitting — Beta initial allele frequency and fitness cost, LogNormal selection coefficient, with all fractions bounded on [0, 1].
- Scenario analysis comparing continuous use, mode-of-action rotation, and rotation-plus-refuge on identical genetic draws.
- Tornado sensitivity analysis isolating the selection coefficient as the dominant driver of usable life and validating the rotation strategy.
- Graphical outputs (time-to-failure histogram, survival curves, resistance-sweep fan chart, tornado) built to communicate evolutionary risk to product-stewardship and R&D-planning stakeholders.
Resistance failure is not an expiry date — it is a survival distribution shaped by genetics no one observes until the sweep is nearly complete. Modeling it as a time-to-event process, rather than a single useful-life number, is what let the company see that its flagship chemistry would most likely fail inside its own planning horizon, and that rotation could double the time it had to prepare a successor.