

Industry: Agriculture and Food Supply Chain
Product: ModelRisk
Application: Pest Control
A $11.7M Average Pest Bill That Hides a 7%-Chance $20M Outbreak Year
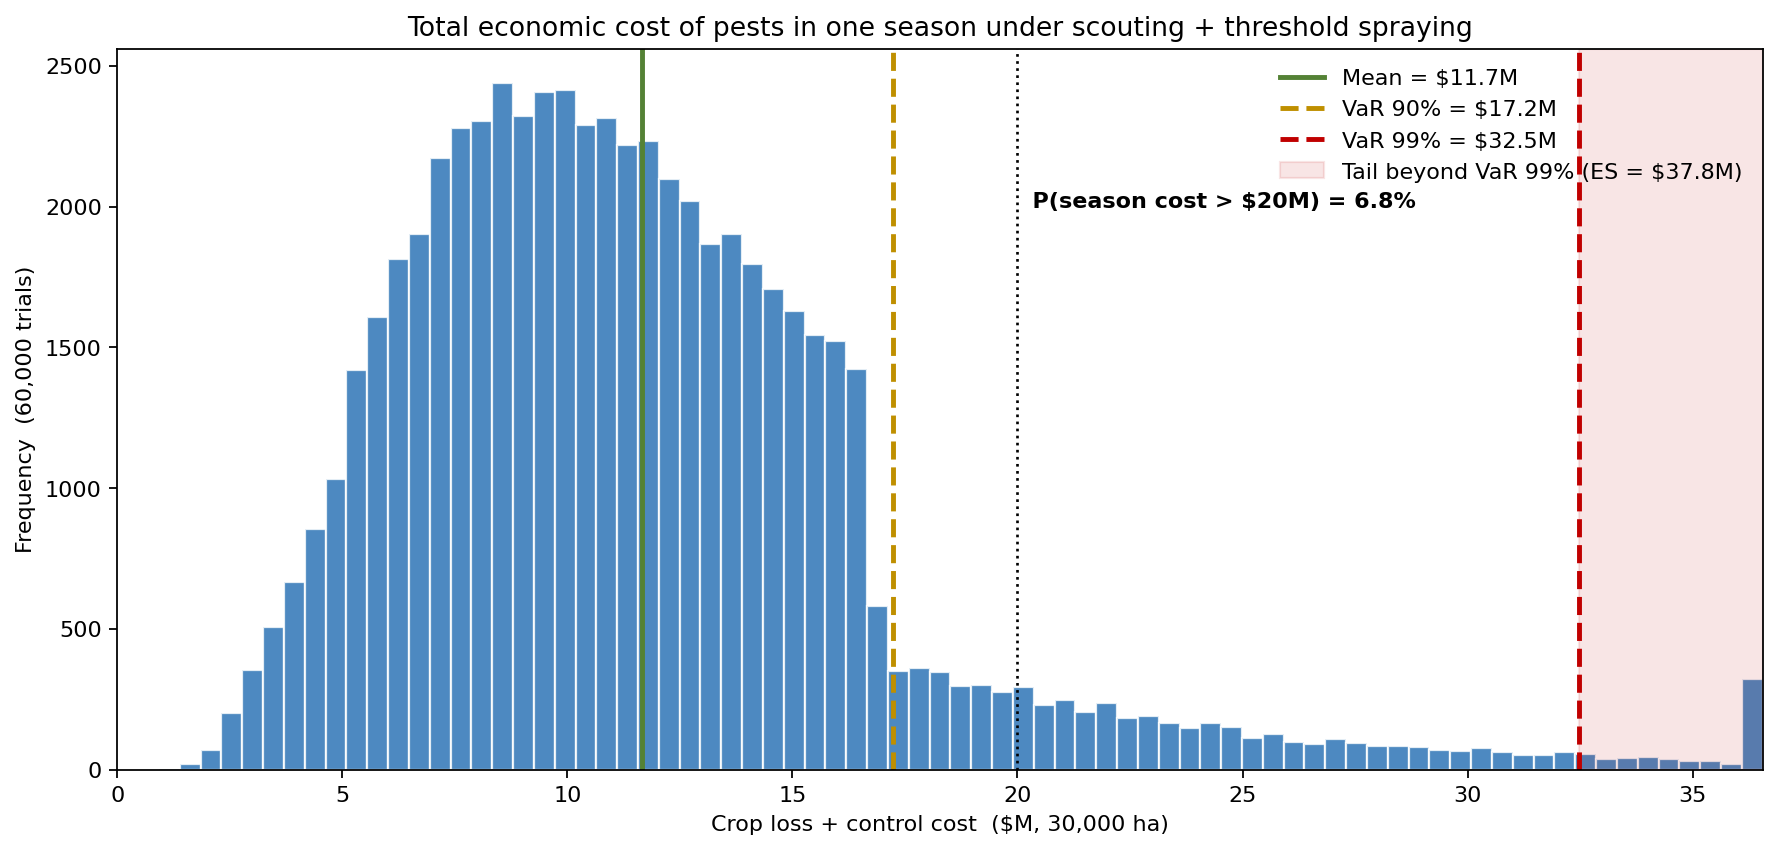
A cooperative farming 30,000 hectares of maize has roughly $62M of standing crop value exposed to pests every season. Run that season 60,000 times under a scouting-plus-economic-threshold spray rule and the average total cost of pests — crop lost plus money spent controlling them — comes out at $11.7M, with a median of $10.8M. That average looks manageable and budgetable. The problem is what sits behind it: a near-30% chance the season tips into an outbreak, a P90 of $17.2M, a P99 of $32.5M, and a 6.8% chance the season costs more than $20M. The cost of pests is not a number the cooperative pays each year — it is a right-skewed distribution with a fat outbreak-year tail, and the years that hurt are precisely the ones an average erases.
The cooperative used Vose Software's ModelRisk to put that distribution in front of its agronomy and finance teams, to compare a fixed calendar-spray program against scouting with an economic-threshold spray rule, and to price the value of seeing the season's pest pressure before committing the spray budget.
Why a point estimate fails here
A deterministic pest plan takes "expected" pest pressure, an "expected" control efficacy, and a single crop price, multiplies them, and reports one number — a tidy average-year loss the budget is built around. The average year, however, almost never arrives. Pest pressure is dominated by a shared seasonal driver: a hot, humid, dry-spell year lifts pressure on every field at once, so field-level losses do not diversify away into a comfortable mean. They pile up together. The result is a distribution whose body sits well below its tail, and whose tail is exactly where the financial pain lives.
The chart above makes the shape literal. The bulk of the probability mass clusters near the $10.8M median, but the curve runs a long way to the right — the P99 of $32.5M is nearly three times the median, and 6.8% of seasons exceed $20M. A single-point plan that provisions for $11.7M is under-reserved in roughly one season in fifteen, and those are the seasons that strain a cooperative's balance sheet.
The shared-weather mechanism that breaks the average
The model is built around one deliberate choice: a single seasonal pest-pressure index W, drawn from a right-skewed LogNormal (mean 1.0, P90 1.74, P99 3.11), scales pressure on the whole 30,000 hectares simultaneously. On top of W, the season has a 29.8% probability of tipping into a true outbreak — a Bernoulli whose probability rises logistically with W — and outbreak years carry a Gamma severity multiplier averaging 2.0x on baseline pressure. Each field then adds its own idiosyncratic Gamma response, but the common factor is what dominates: because W is shared, a heavy year is heavy everywhere, and the portfolio loss stays fat-tailed instead of collapsing to a thin Gaussian average.
Effective pressure feeds a saturating (Hill-type) damage curve bounded on [0, 1], so the loss fraction can never exceed total crop value and never goes negative. Crop loss in dollars is that fraction times the $62M crop value at risk; the grower's total cost adds the control-program spend on top.
Comparing control policies across the whole distribution
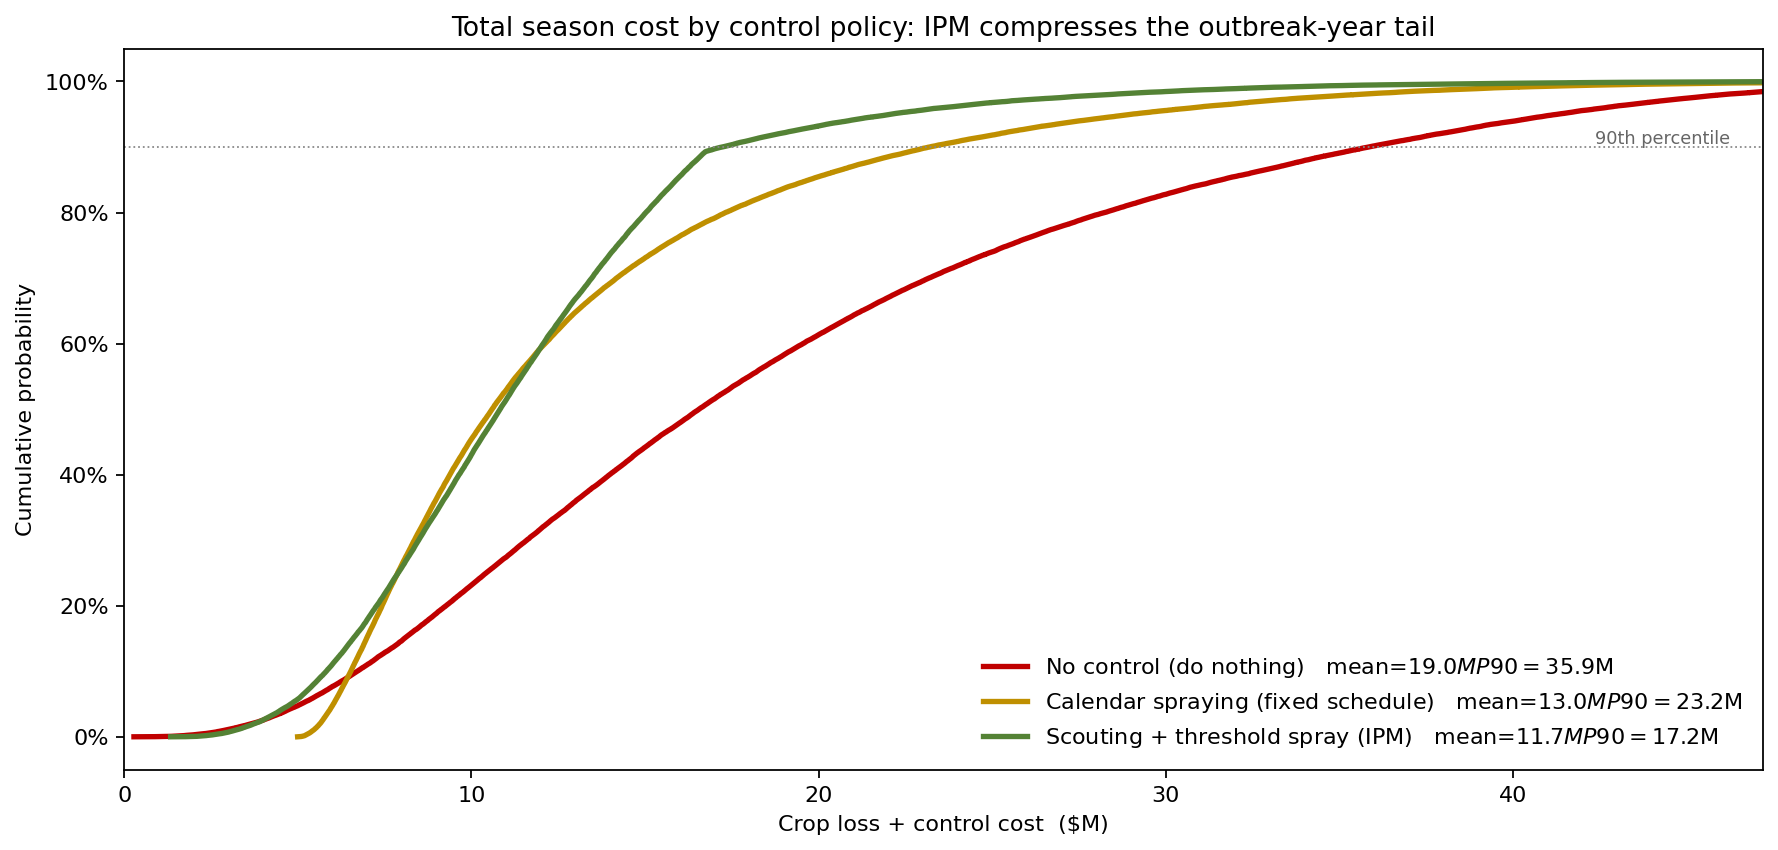
Three policies are run on identical seasons:
- No control — mean total cost $19.0M, P90 $35.9M, P99 $48.9M. Doing nothing is the most expensive option on average and has by far the worst tail.
- Calendar spraying — a fixed full-season program (blanket ~70% efficacy, high fixed cost). Mean $13.0M, P90 $23.2M, P99 $39.4M. It cuts the average but still pays the full spray bill in benign years it didn't need to.
- Scouting + economic-threshold spraying (IPM) — scout the crop, spray only the 38% of seasons where pressure crosses the economic threshold, and spray more effectively when you do. Mean $11.7M, P90 $17.2M, P99 $32.5M.
The decisive comparison is not the means — IPM and calendar are close on average — but the tail. IPM's P90 of $17.2M undercuts calendar's $23.2M by $6M, because it stops paying for sprays in the many benign seasons while still hitting hard in the heavy ones. The CDF shows IPM's curve sitting left of calendar's across the entire upper range: targeting buys most of its value in the bad years, which is exactly where it matters.
What actually drives the cost
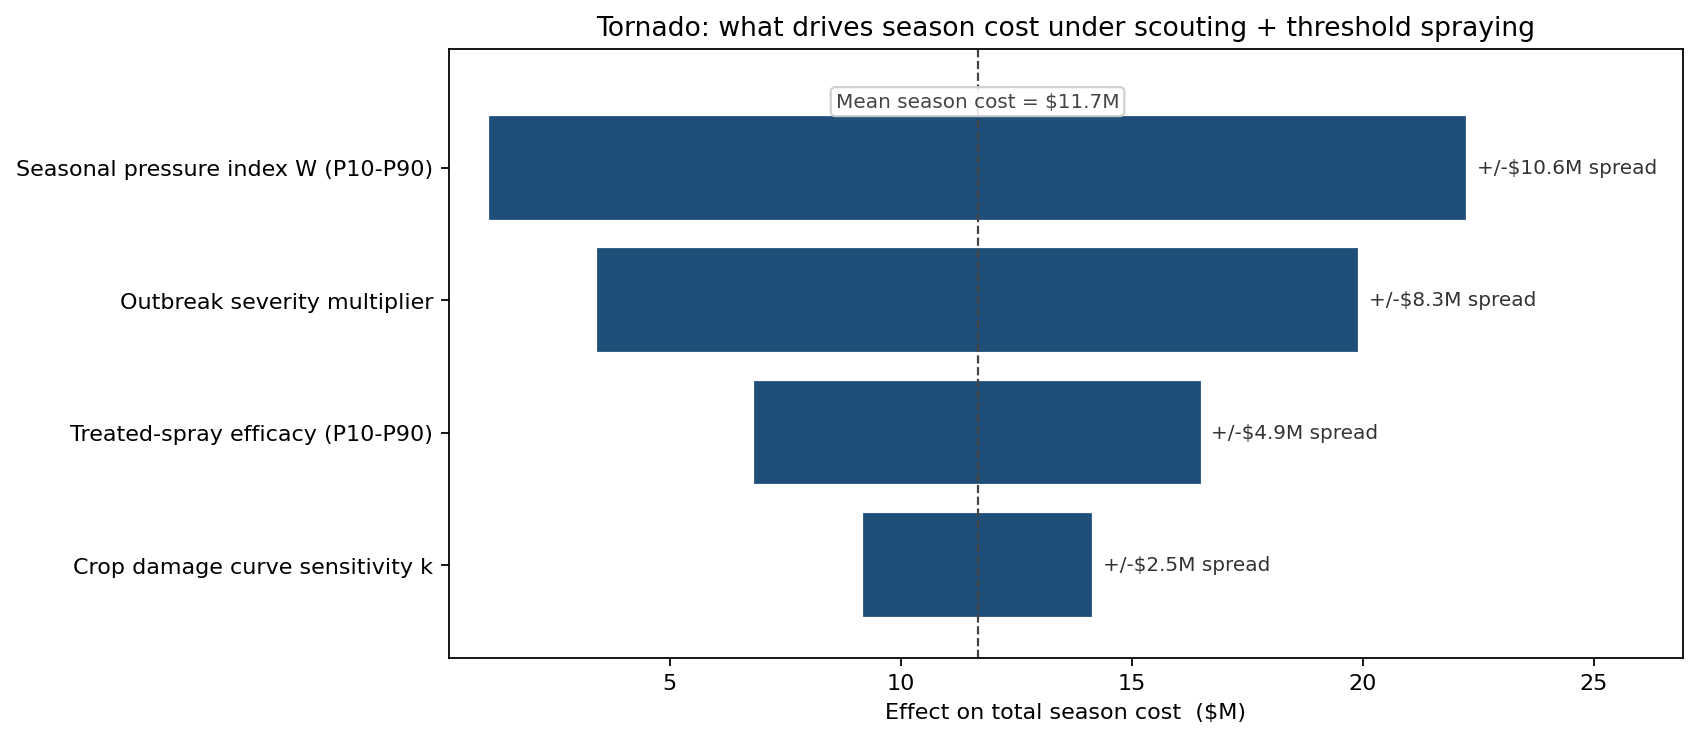
Swinging each driver from its P10 to its P90 with the others held central, the seasonal pressure index W dominates with a +/-$5.3M swing, followed by the outbreak severity multiplier (+/-$4.1M). Together the two weather-driven, shared-factor inputs account for the overwhelming majority of cost uncertainty. Treated-spray efficacy (+/-$2.4M) and the damage-curve sensitivity (+/-$1.3M) trail well behind. The ranking carried a clear operational message: the single most valuable investment is not a better spray, but better information about the season's pressure — earlier and denser scouting — because pressure, not efficacy, is what moves the bill.
The value of seeing the season first
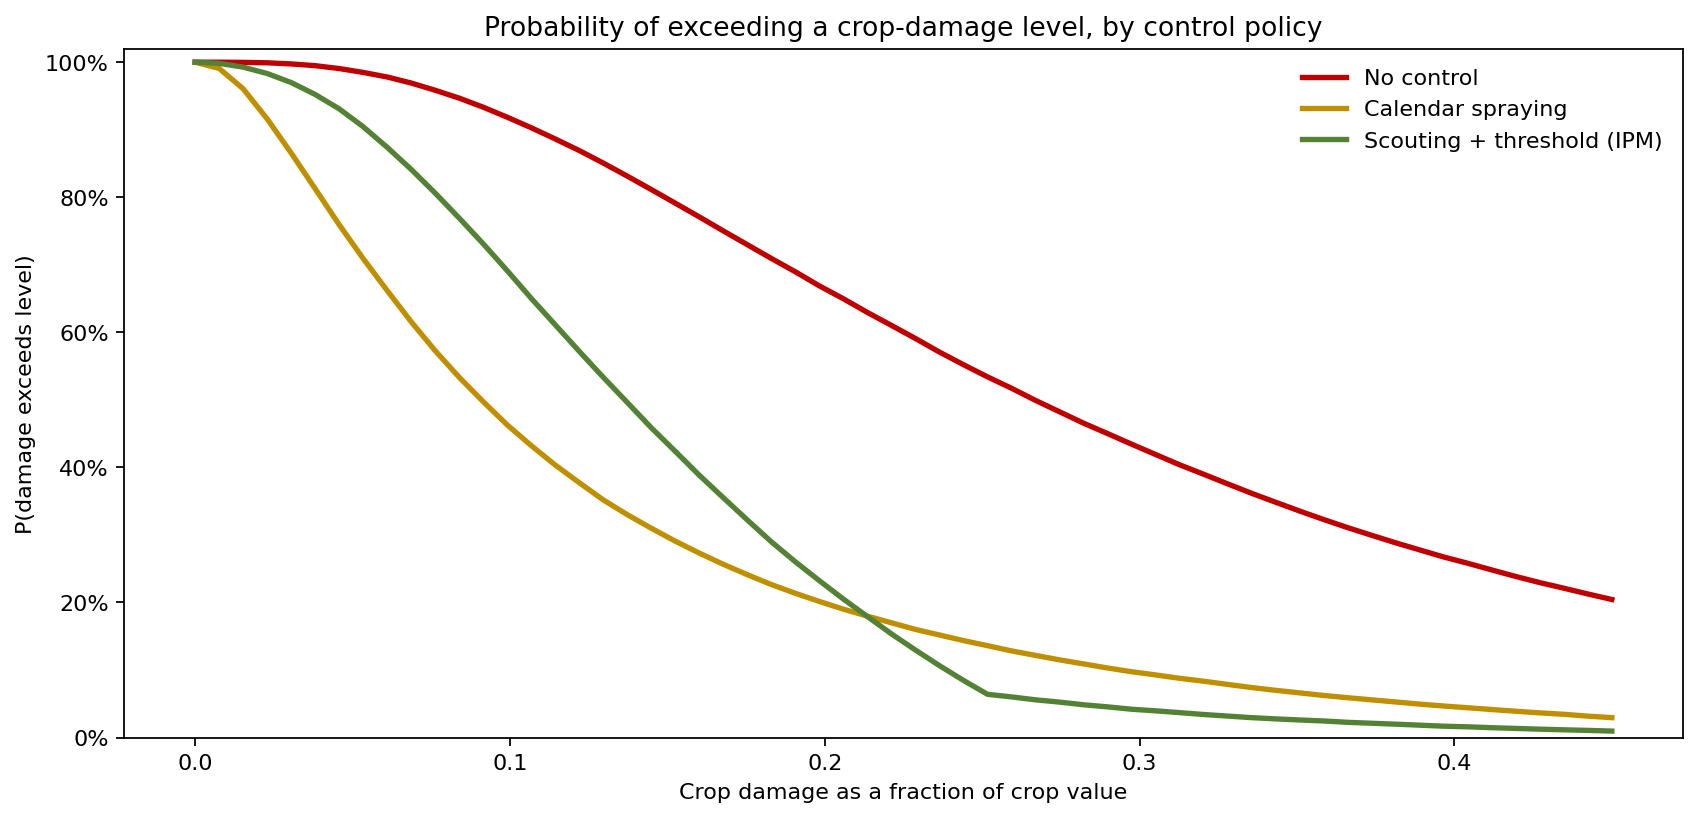
Reading the probability of exceeding a given crop-damage fraction directly quantifies the protection each policy buys. At a 10% damage level, the chance of exceeding it falls from 91.8% with no control to 69.1% under IPM; at a 20% damage level it drops from 66.9% with no control to 23.2% under IPM — essentially level with calendar spraying's 20.1%, but achieved while spraying in only 38% of seasons. IPM does not merely shift the average; it pulls down the probability of a damaging year across the whole loss axis, and it does so at a fraction of calendar spraying's routine cost.
What the model changed
- The cooperative adopted scouting with an economic-threshold spray rule. It delivered a lower mean cost than calendar spraying and a materially thinner outbreak-year tail (P90 down $6M), spraying in only the 38% of seasons that warranted it.
- The pest budget was set on the P90, not the mean. Because the season cost is right-skewed with a real $20M-plus tail, reserving against the $11.7M average left the cooperative under-provisioned one year in fifteen. The reserve was re-based on the $17.2M P90.
- Scouting investment was prioritised over spray chemistry. The tornado showed seasonal pressure and outbreak severity — both reducible only through earlier detection — dominating spray efficacy, redirecting spend toward denser monitoring and pressure forecasting.
- Outbreak years were planned for explicitly. With a quantified 29.8% outbreak probability and a 2.0x severity multiplier, the cooperative pre-arranged surge spray capacity and contingency financing rather than scrambling when a heavy year hit.
ModelRisk Functionality Used
- Monte Carlo simulation across 60,000 seasons, propagating shared weather pressure, outbreak occurrence, severity, and field-level response into a single cost distribution.
- A shared common-factor structure — one seasonal pressure index driving every field — that keeps the portfolio loss fat-tailed instead of averaging it away.
- Distribution fitting — LogNormal seasonal pressure, a logistic outbreak probability, Gamma severity and field response, and Beta spray efficacies bounded on [0, 1].
- Scenario analysis comparing no-control, calendar, and IPM policies on identical simulated seasons.
- Tornado sensitivity analysis ranking seasonal pressure and outbreak severity above spray efficacy and directing the scouting investment.
- Graphical outputs (right-skewed cost histogram, policy CDF, tornado, damage-exceedance sweep) built to communicate tail risk to agronomy and finance stakeholders.
Pests do not cost a cooperative its average bill — they cost it a distribution, and the seasons that decide the year live in the tail. Only a Monte Carlo model holds the manageable average and the dangerous outbreak year in the same picture, and only then can the spray budget be sized for both.