

Industry: Agriculture and Food Supply Chain
Product: ModelRisk
Application: Optimizing Livestock Management Under Uncertainty
The Budget Penciled 304 a Head. One Batch in Five Loses Money.
A finishing operation placing a batch of 5,000 head budgeted the way feedlot offices everywhere do: take a target finishing weight of 620 kg, an expected carcass price, an assumed survival rate, a budgeted feed bill, and read off a net margin of 304 per head — a comfortable 1.52M on the batch. The arithmetic is sound. What it omits is that a finishing batch does not fail gradually and independently, animal by animal; it fails all at once when a disease event sweeps the pen, and the budget has no line for that.
Carried as a Monte Carlo simulation, the same batch shows a mean margin of 240 per head but a 19% chance of a loss-making batch, a P10 margin of -150 per head, and a P5 batch loss of 1.6M. The point estimate sits near the top of a distribution whose dangerous end is a deep, disease-driven lower lobe — invisible to any calculation that uses a single survival rate.
The risks that do not average out
The per-head weight scatter that dominates a naive model is the one risk that genuinely does wash out: across 5,000 animals, idiosyncratic variation in finishing weight averages to almost nothing. The risks that matter are the shared shocks that hit the whole batch together, and the model is built around two of them.
- Disease events. A batch-wide outbreak fires as a Bernoulli with 12% probability. When it fires, it does two things at once: it lifts mortality through a Beta severity term on top of a ~2.8% endemic baseline, and it knocks down the finishing weight of the survivors by up to ~18%. Mortality runs at a 5.3% mean but a 12.6% P90 and a 41.9% P99 — the entire upper tail is the outbreak scenario.
- Feed-cost volatility. Feed is the largest variable cost, 1,650 kg per head, priced through a right-skewed LogNormal that puts the mean feed price at 0.34 per kg but the P90 at 0.44 — a grain-spike season that raises the cost of every animal in the pen simultaneously.
Carcass price carries a milder batch-wide LogNormal scatter on top. The result is a margin distribution that is not a tidy bell curve but a main body with a distinct lower lobe.
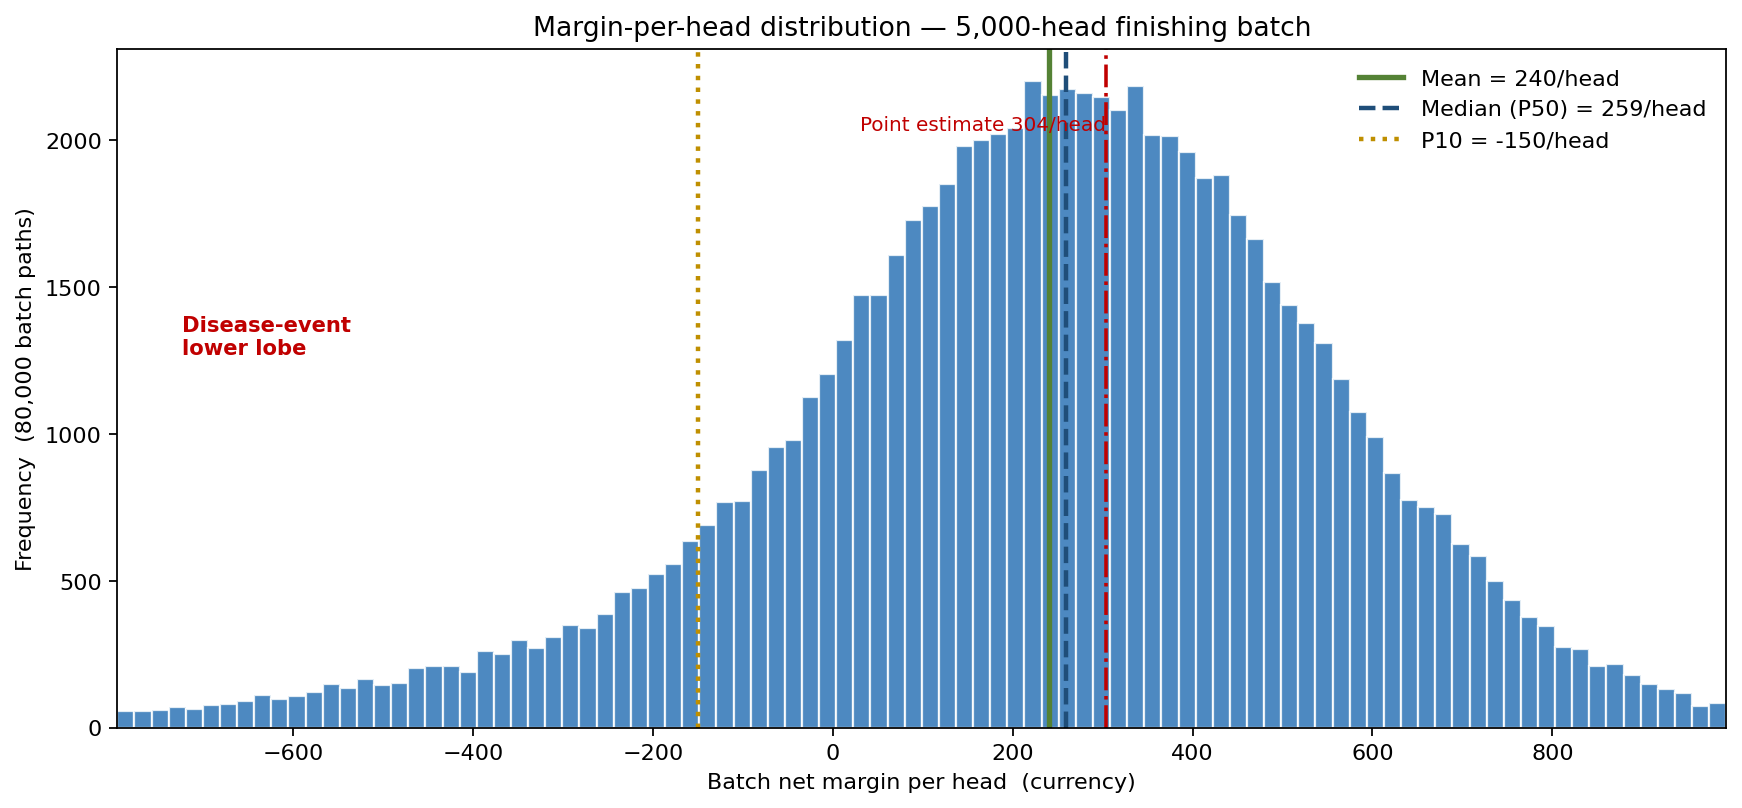
The headline distribution shows it. The mean margin is 240 per head and the median 259, against the deterministic 304. But a disease-event lower lobe drags the P10 down to -150 per head — a 5,000-head batch losing three-quarters of a million in a bad outbreak year. The point estimate is not a forecast of the typical batch so much as a description of the batches where nothing goes wrong.
Why a point estimate fails here
A single survival rate is the load-bearing simplification, and it is exactly the wrong one. Mortality is not a smooth average; it is a low endemic baseline punctuated by rare, severe outbreak years. Plugging in the 5.3% mean mortality produces a margin near the budget, but it erases the bimodality entirely — the 12% of batches that carry the outbreak, where mortality and weight loss compound into the loss lobe. The mean answers "what does a clean batch return?"; the distribution answers "how often, and how badly, does a batch break?" — and only the second question prices the case for biosecurity.
What biosecurity is worth
The operation evaluated a biosecurity and vaccination programme costing 22 per head that cuts the outbreak probability from 12% to 4% and softens its severity when it does occur. The simulation values it by re-running the batch under the improved disease profile.
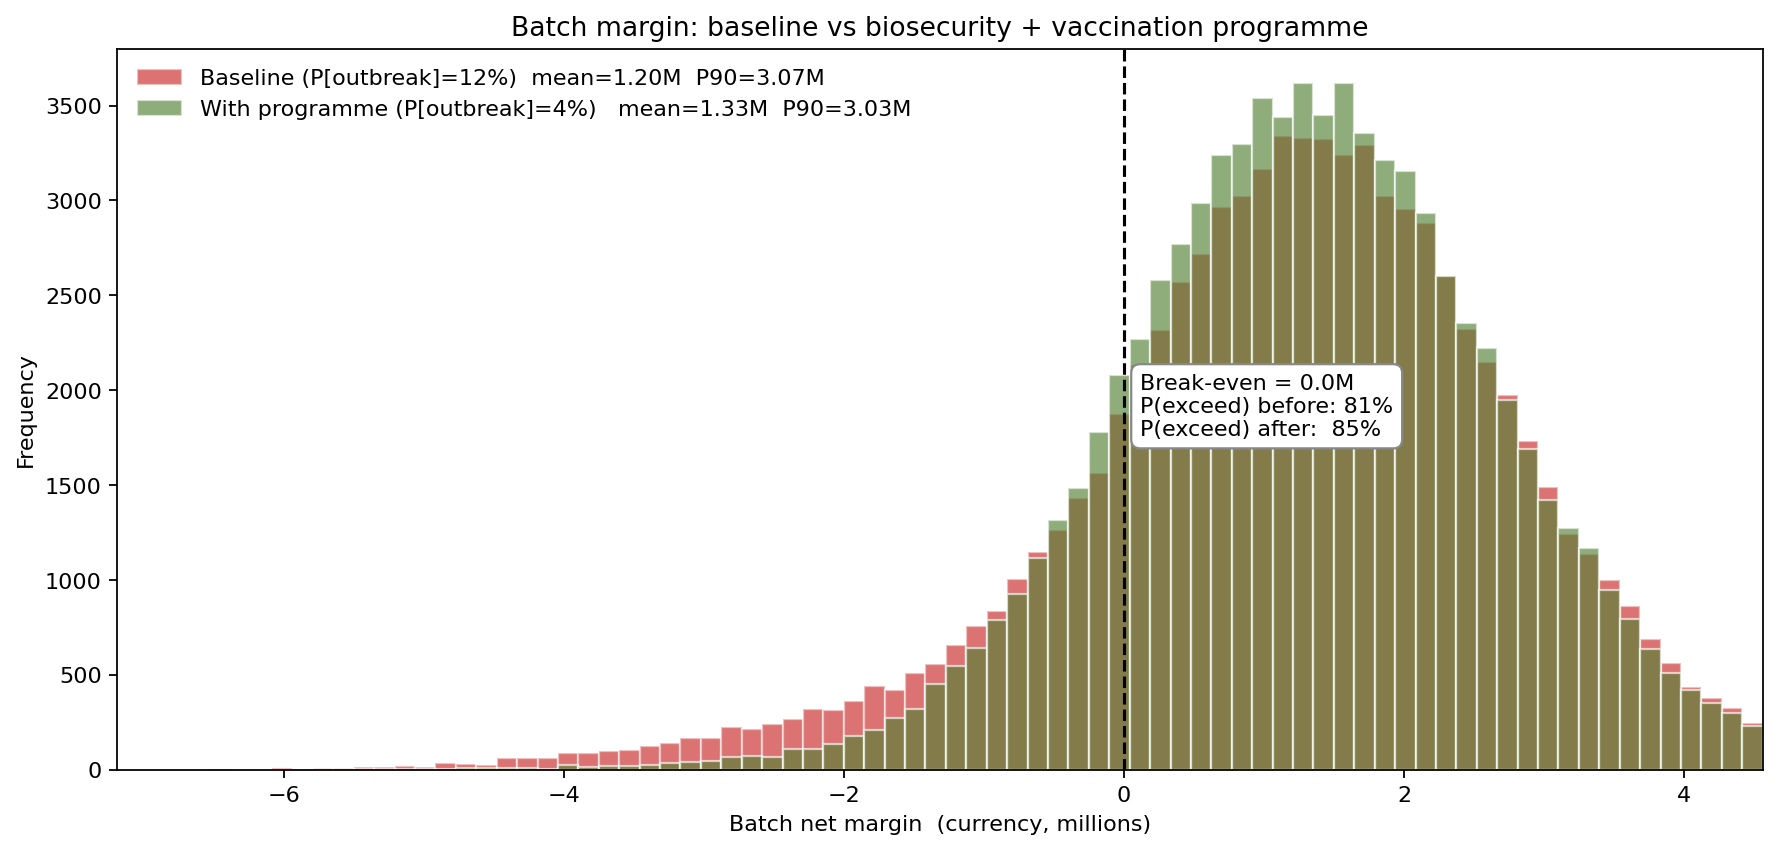
The before/after histograms show the programme attacking the loss lobe specifically. The probability of a loss-making batch falls from 19% to 15%, and the mean batch margin rises from 1.20M to 1.33M — an expected gain of 0.12M per batch against a programme cost of 0.11M. The headline is deliberately undramatic: on expected value the programme barely pays for itself. Its real value is in the variance it removes — it is loss-tail insurance, and a risk-averse operator funds it for the four percentage points off the loss probability, not the thin expected return. That is a judgement a point estimate cannot even frame.
What actually moves the batch margin
With four uncertain inputs, the tornado ranks where the variance comes from.
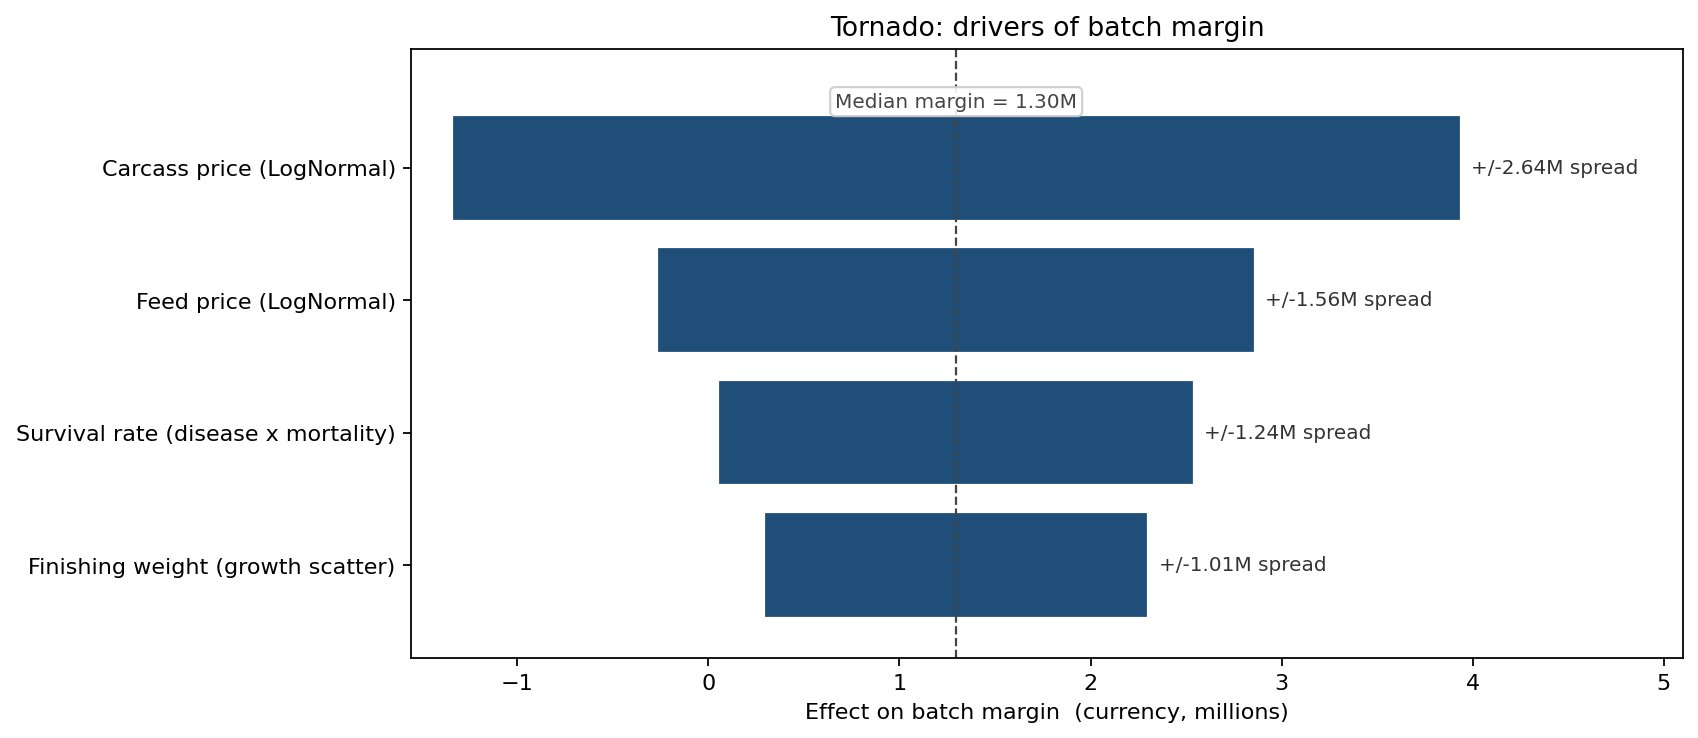
Carcass price is the largest single driver at +/-1.32M of margin swing, followed by feed price at +/-0.78M and survival rate at +/-0.62M; finishing weight is smallest at +/-0.50M. The ordering carries a clear message: market exposure (carcass and feed prices together) dwarfs the biological levers on a clean batch. But the tornado measures typical P10–P90 swing — it deliberately understates survival, because the survival risk is concentrated in the rare outbreak tail the tornado's symmetric range cannot capture. The margin histogram and the tornado are complementary: one shows the tail, the other the body.
Two ways a batch goes wrong at once
The deepest losses come when shocks compound — a feed-price spike and a disease year in the same batch.
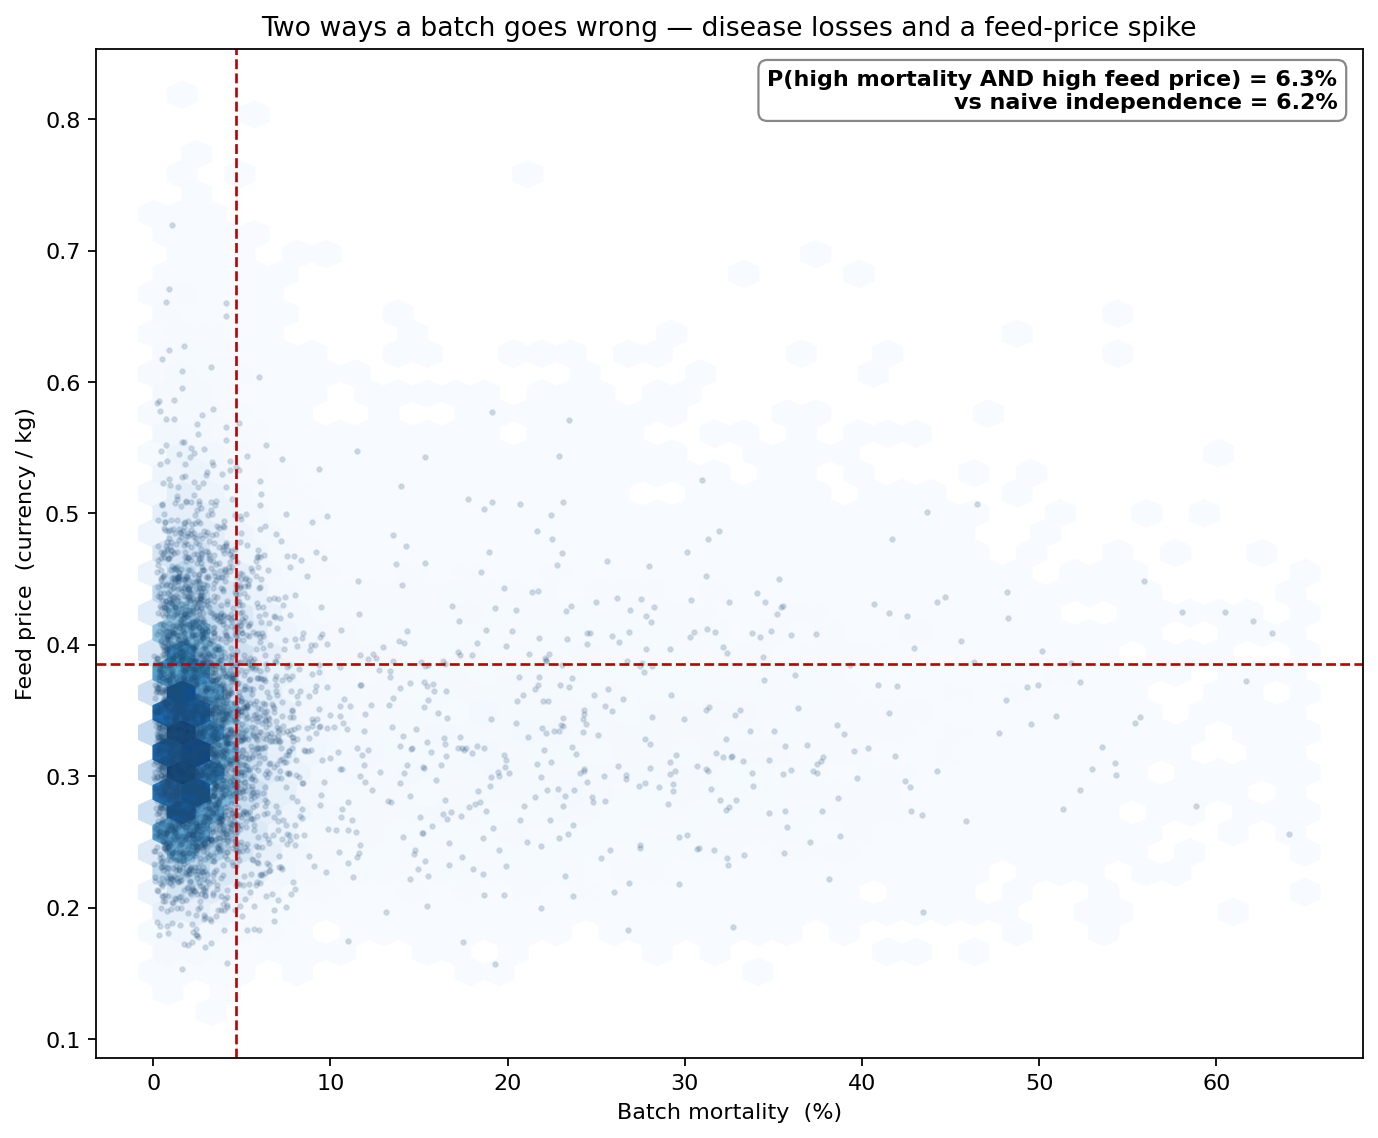
The joint density quantifies the compound corner. High mortality and high feed price coincide in 6.3% of batches, essentially the 6.2% that independence predicts — the two shocks are not correlated here, but they are additive, and the upper-right quadrant is where a 5,000-head batch posts its worst result. Pricing that corner explicitly is what justifies holding working capital against a bad batch rather than budgeting to the mean.
From insight to action
The operation managed the batch against its distribution:
- Biosecurity funded as tail insurance. The programme is justified on the four-point cut to loss probability, not its near-zero expected return — a decision the mean margin would have rejected.
- Feed cost hedged, because the tornado says so. With feed price the second-largest driver at +/-0.78M, the operation forward-buys part of the ration to cap the grain-spike exposure.
- Placement sized against P10. Knowing the P10 margin is -150 per head, the operation holds working capital to absorb a loss-making batch rather than assuming the 304-per-head budget every cycle.
ModelRisk functionality used
- Monte Carlo simulation propagating mortality, finishing weight, feed price and carcass price through the batch margin across 80,000 batch paths.
- Frequency-severity disease modelling — a Bernoulli outbreak event (12%) driving a Beta mortality-severity spike and a survivor weight penalty, producing the bimodal loss lobe.
- LogNormal cost and price for feed (mean 0.34, P90 0.44 per kg) and carcass value, the batch-wide market shocks that do not average out.
- Before/after scenario comparison valuing the biosecurity programme — loss probability 19% to 15%, mean margin 1.20M to 1.33M.
- Tornado sensitivity ranking carcass price (+/-1.32M), feed price (+/-0.78M) and survival, and a joint mortality-feed density pricing the compound-bad-luck corner.
Monte Carlo turns livestock management from "what does a batch return?" into "how often does a batch break, what breaks it, and what is it worth to narrow that tail?" — and on this operation the honest answers were a 19% loss probability and a biosecurity programme worth funding for the variance it removes, not the margin it adds.