

Industry: Agriculture and Food Supply Chain
Product: ModelRisk
Application: Irrigation Planning
The Mean-Climate Plan Showed a 16 Mm3 Surplus. Three Seasons in Ten Run Dry.
An irrigation district serving a 12,000-hectare command area sized its season the way a deterministic water budget always does: take average rainfall, average reservoir storage, the licensed groundwater cap and an average crop water requirement, add them up, and confirm a comfortable 16 Mm3 surplus of supply over demand. On paper the district has plenty of water. In the field, it rations crops in 29% of seasons.
The gap comes from a coupling the average-climate plan structurally cannot represent. The same dry, hot season that shrinks the surface allocation and the rainfall capture is also the season when thirsty crops demand the most irrigation. Supply falls and demand rises together, so the water deficit has a fat, correlated upper tail — and a budget built on independent averages lands squarely in the middle of it, blind to the dry-year corner where the rationing actually happens.
Supply and demand move in opposite directions — together
The model is driven by one shared seasonal climate factor. A dry season cuts three things at once and lifts a fourth:
- Surface allocation — the regulator announces a percentage of a 78 Mm3 entitlement scaled to rainfall-driven reservoir storage; in a drought the announced share collapses.
- On-farm rainfall capture — a Gamma-distributed contribution that shrinks in the same dry year.
- Groundwater — a licensed firm cap of 20 Mm3, Beta-distributed around availability, and the only supply line that does not fall with the climate.
- Crop evapotranspiration demand — which rises in a hot, dry season, modelled as a base requirement of 6.6 ML/ha lifted by the climate factor and scattered by agronomic noise.
Because supply loads positively on the climate factor and demand loads negatively, the two are strongly anti-correlated: the simulated supply-demand correlation is -0.75. That single number is why the deficit tail is so much fatter than independent averages imply.
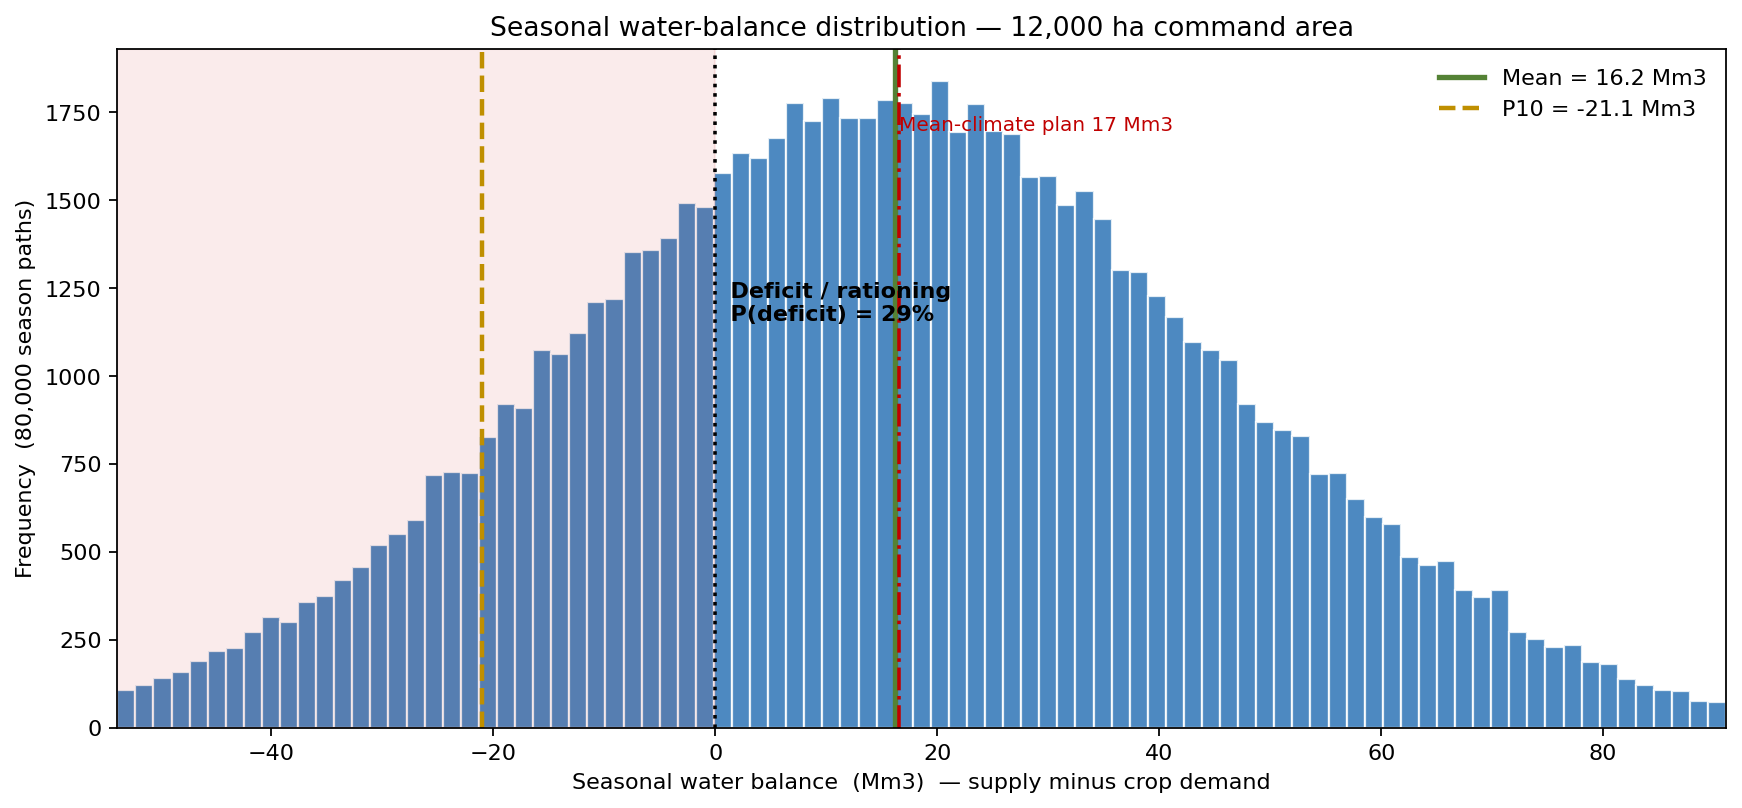
The headline balance distribution makes the trap concrete. The mean balance is +16.2 Mm3 and the deterministic mean-climate plan lands almost exactly on it at +16.5 Mm3 — the point estimate is not biased on average. But the P10 balance is a -21.1 Mm3 deficit, and the curve crosses zero into rationing 29% of the time. Averaging the climate away does not just blur the answer; it deletes the entire dry-season failure mode the district exists to manage.
Why a point estimate fails here
A water budget is the textbook case where a mean is dangerously reassuring. The balance is the difference of two large, anti-correlated quantities, so its expected value is comfortably positive while its lower tail dips deep into deficit. A planner reading only the +16.5 Mm3 mean concludes the district is over-supplied and defers investment. The simulation reads the same inputs and reports a 29% chance of any rationing and a 15.5% chance of cutting more than 15% of crop demand — the difference between "we have spare water" and "we ration crops every third year."
When the deficit opens up
A seasonal total hides when the water runs short. Disaggregating each season into 26 weekly steps that share the same climate factor, with demand following the crop-coefficient curve that peaks mid-season, traces the balance through the year.
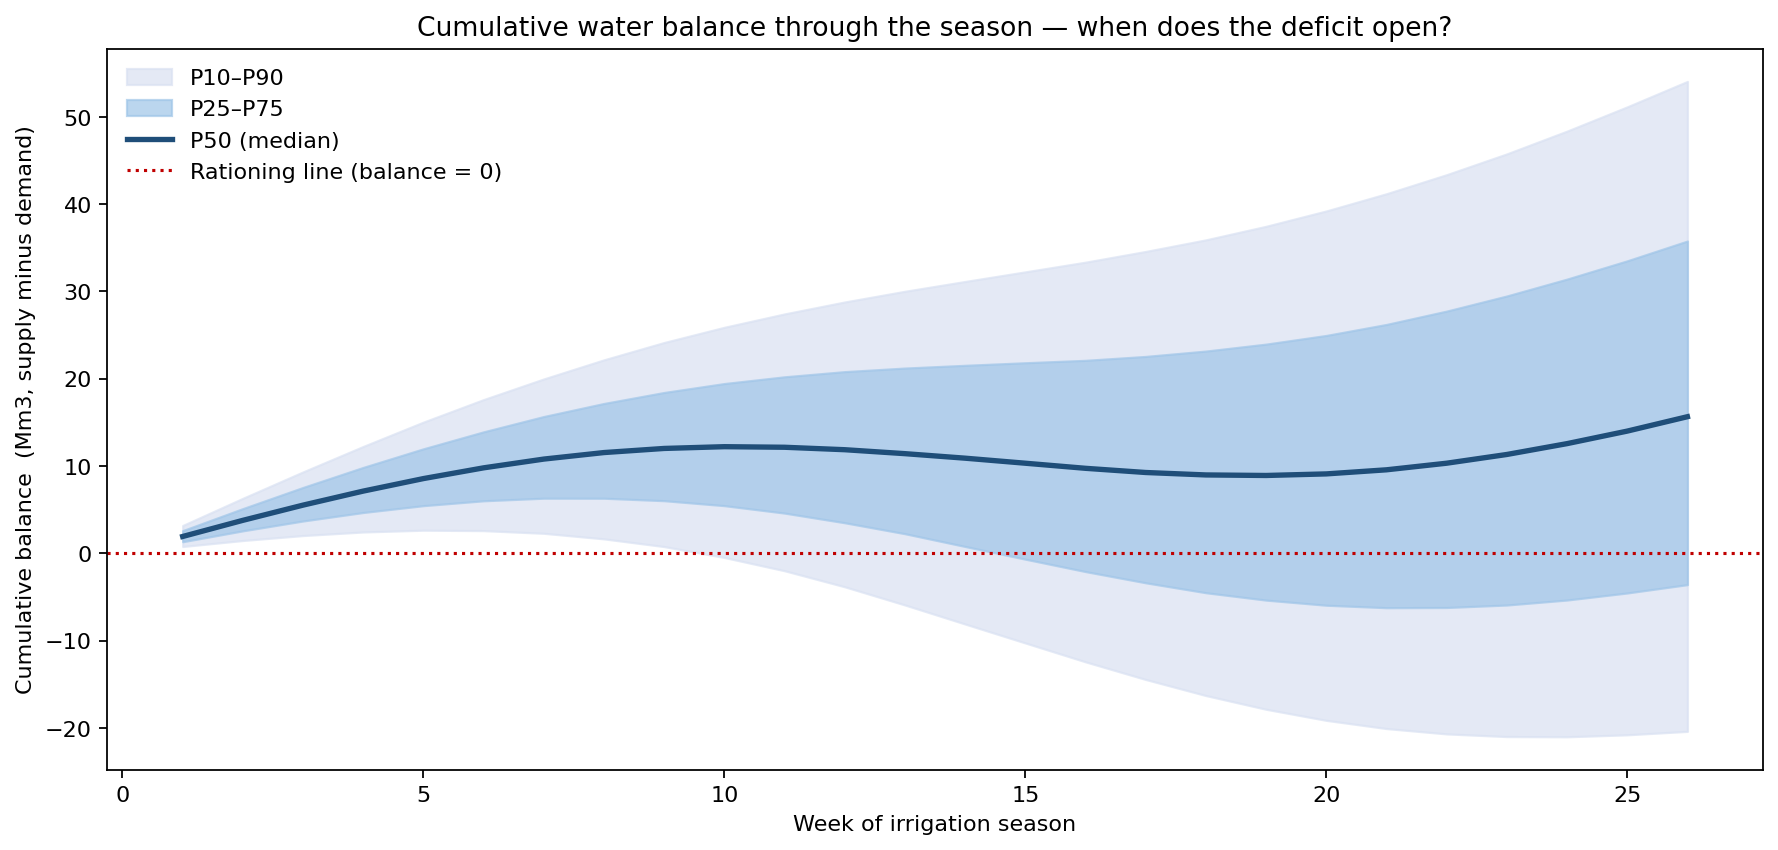
The fan chart shows the median path ending the season at +15.7 Mm3 while the P10 path finishes at -20.4 Mm3 and the P90 at +54.1 Mm3. The bands splay open through the peak-demand weeks in the middle of the season — exactly when a dry year bites — so the rationing decision has to be made before the crop coefficient peaks, not after the reservoir is already drawn down.
How much firm allocation buys reliability
The district's real decision is a sizing question: how much additional secured firm allocation (a reservoir carry-over reserve or a top-up entitlement) must it lock in so that the chance of rationing stays acceptably low?
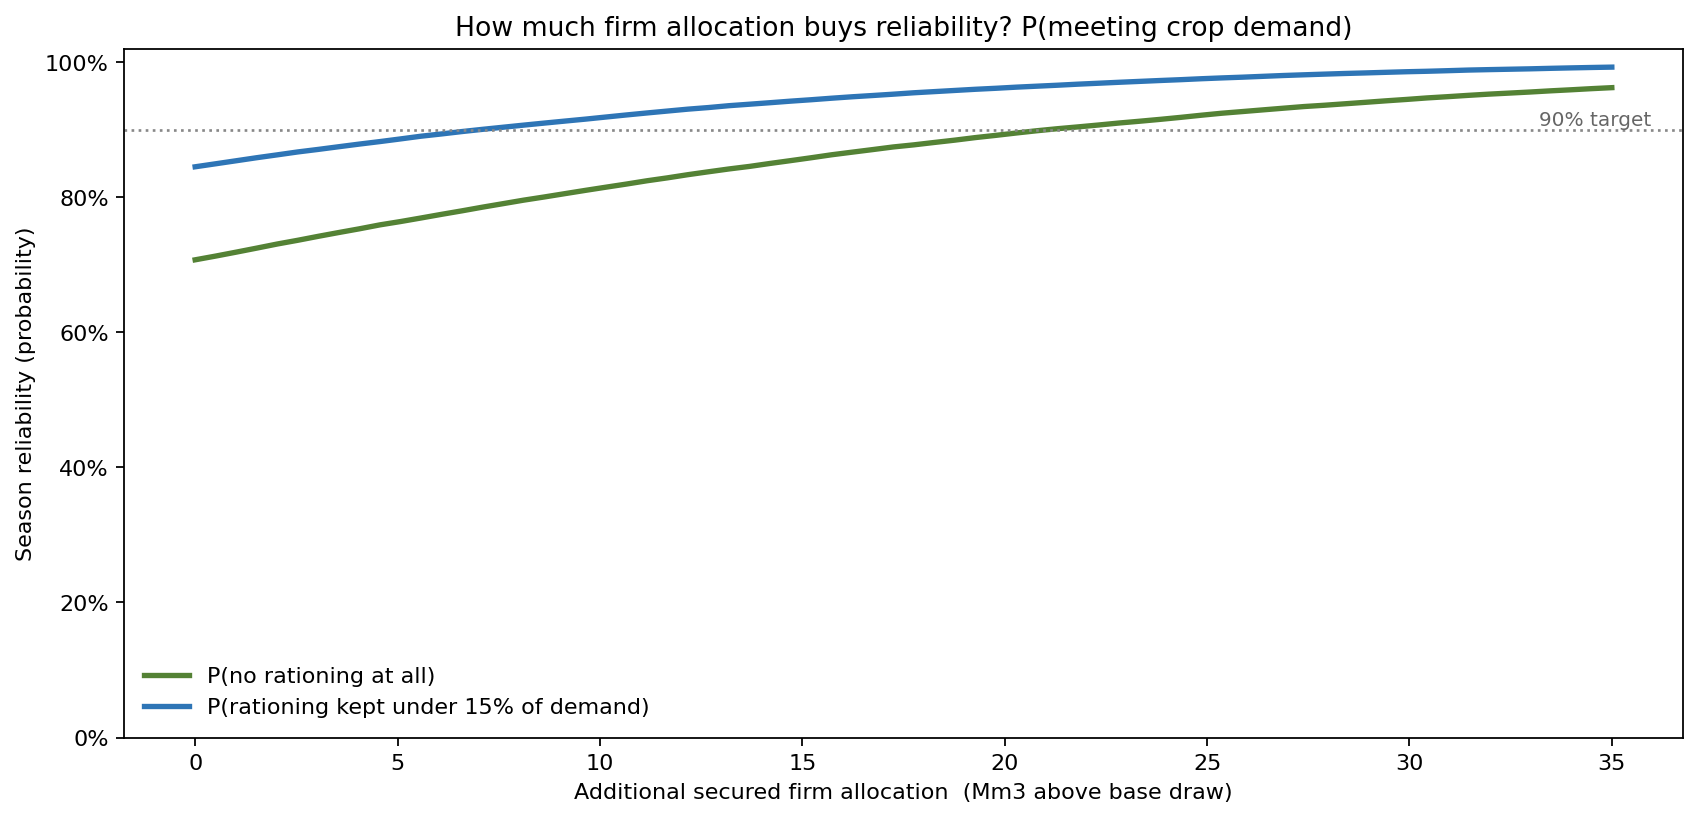
The sweep answers it directly. With no extra allocation the district avoids rationing in only 71% of seasons (and keeps rationing under 15% of demand in 85%). To reach a 90% no-rationing reliability standard, it must secure roughly 21 Mm3 of additional firm supply. That is the number a sizing decision needs — not "we have a surplus on average," but "21 Mm3 of firm reserve is the price of a one-in-ten failure standard."
What actually moves the balance
With four supply-and-demand components all uncertain, the tornado shows where the variance lives.
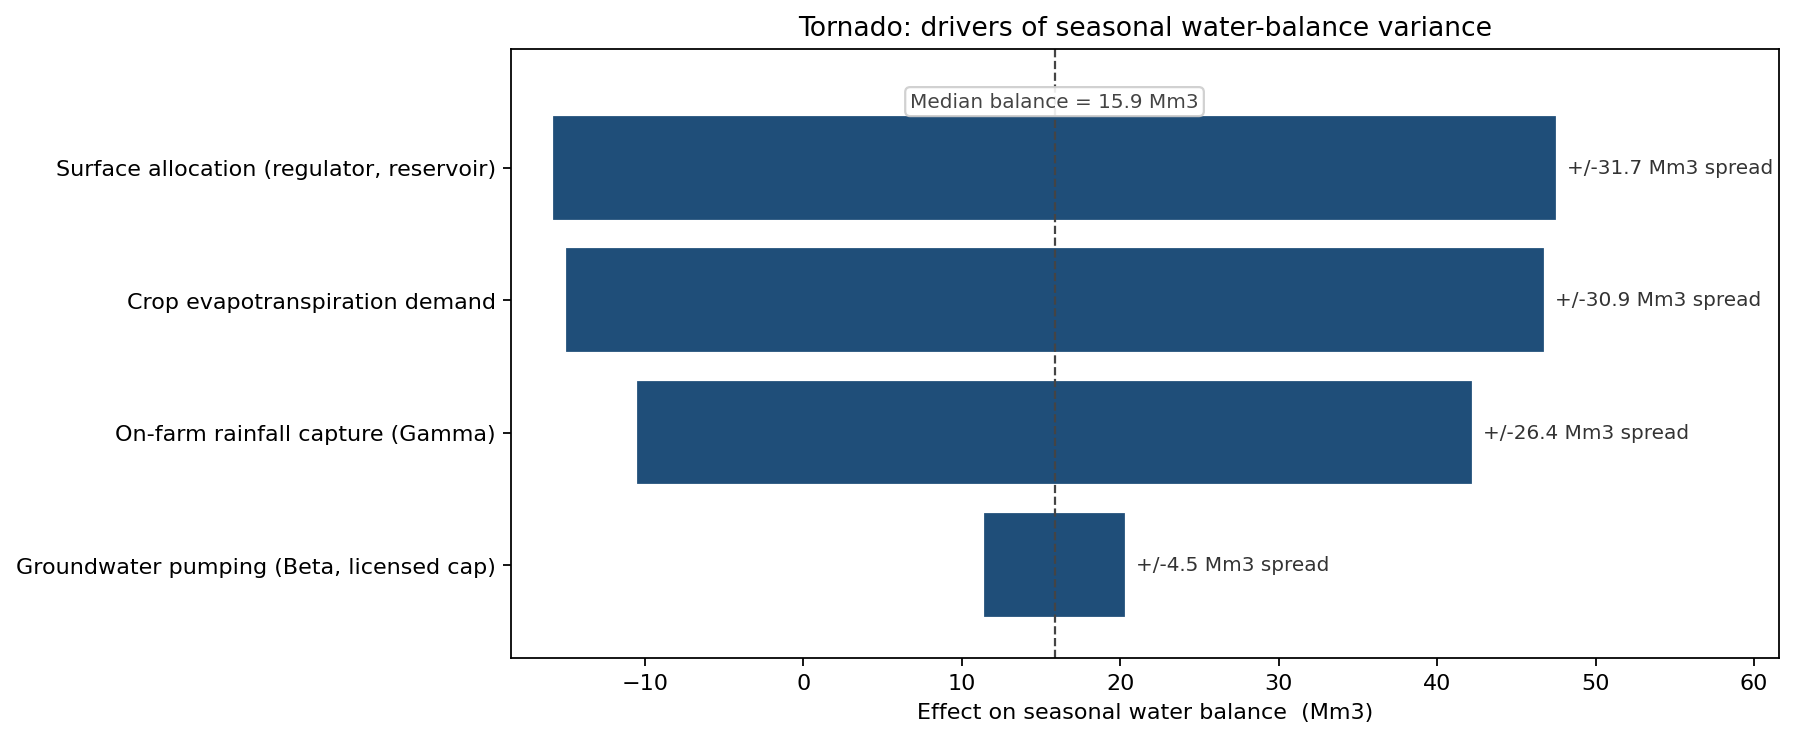
Surface allocation dominates at +/-15.9 Mm3 of balance swing, with crop evapotranspiration demand a close second at +/-15.5 Mm3 — the two ends of the climate coupling. On-farm rainfall capture follows at +/-13.2 Mm3, while the licensed groundwater cap is almost flat at +/-2.3 Mm3, precisely because it is the one firm, climate-independent line. The ranking tells the district where to spend: securing the regulator-set surface allocation and managing peak crop demand move the needle; the groundwater licence is reliable but too small to be the answer.
From insight to action
The district planned against the distribution, not the average:
- A 21 Mm3 firm reserve. Sized directly off the reliability sweep to hold rationing to a one-in-ten season standard, rather than trusting the comfortable mean-climate surplus.
- Demand management timed to the fan. Deficit-irrigation triggers and crop-mix adjustments are scheduled for the mid-season peak-demand weeks where the P10 path dives, not applied as a flat seasonal cut.
- Investment justified on the dry tail. The business case for the reserve rests on the 29% rationing frequency the simulation exposed, a number the deterministic budget reported as zero.
ModelRisk functionality used
- Monte Carlo simulation combining a regulator-scaled surface allocation, Gamma rainfall capture, a Beta groundwater draw and a climate-lifted crop demand across 80,000 season paths.
- Shared-driver correlation — one seasonal climate factor loading supply down and demand up, reproducing the -0.75 supply-demand correlation that fattens the deficit tail.
- Reliability sweep computing P(no rationing) across secured-allocation levels to read off the 21 Mm3 needed for a 90% standard.
- Time-stepped fan chart disaggregating the season into 26 weeks to show the deficit opening through the peak-demand period.
- Tornado sensitivity ranking the four balance drivers, isolating surface allocation (+/-15.9 Mm3) and crop demand (+/-15.5 Mm3).
Monte Carlo turns irrigation planning from "is there a surplus on average?" into "how often do we ration, and what firm reserve buys a one-in-ten failure standard?" — and on this command area the honest answers were 29% and 21 Mm3, neither of which the mean-climate budget could see.