

Industry: Agriculture and Food Supply Chain
Product: ModelRisk
Application: Food quality control
A 1-in-5 Bad Lot Walks Past the Inspection Plan: Sizing Acceptance-Sampling Risk Before It Ships
A food processor receiving incoming agricultural lots ran a standard single-sampling acceptance plan: pull 80 units per lot, accept if 2 or fewer are defective. On paper it looked disciplined. But when the true defect rate of a lot reaches the rejectable quality level of 6.5% defective, that plan still accepts the lot 10% of the time — and across a year of 250 lots from a supplier whose quality drifts seasonally, there is a 23% chance that at least one genuinely out-of-spec batch is inspected, passed, and shipped to customers.
The plan's own arithmetic is invisible in a pass/fail inspection log. A deterministic capability report shows the lots that were rejected; it never shows the bad lots the plan was always going to wave through, nor how that escape probability changes if the sample size or acceptance number moves. The team rebuilt the plan as a Monte Carlo model in ModelRisk — 40,000 simulated supplier-years, each with an uncertain lot-quality level and 250 inspected lots — to put a number on the escape risk and to price the alternatives.
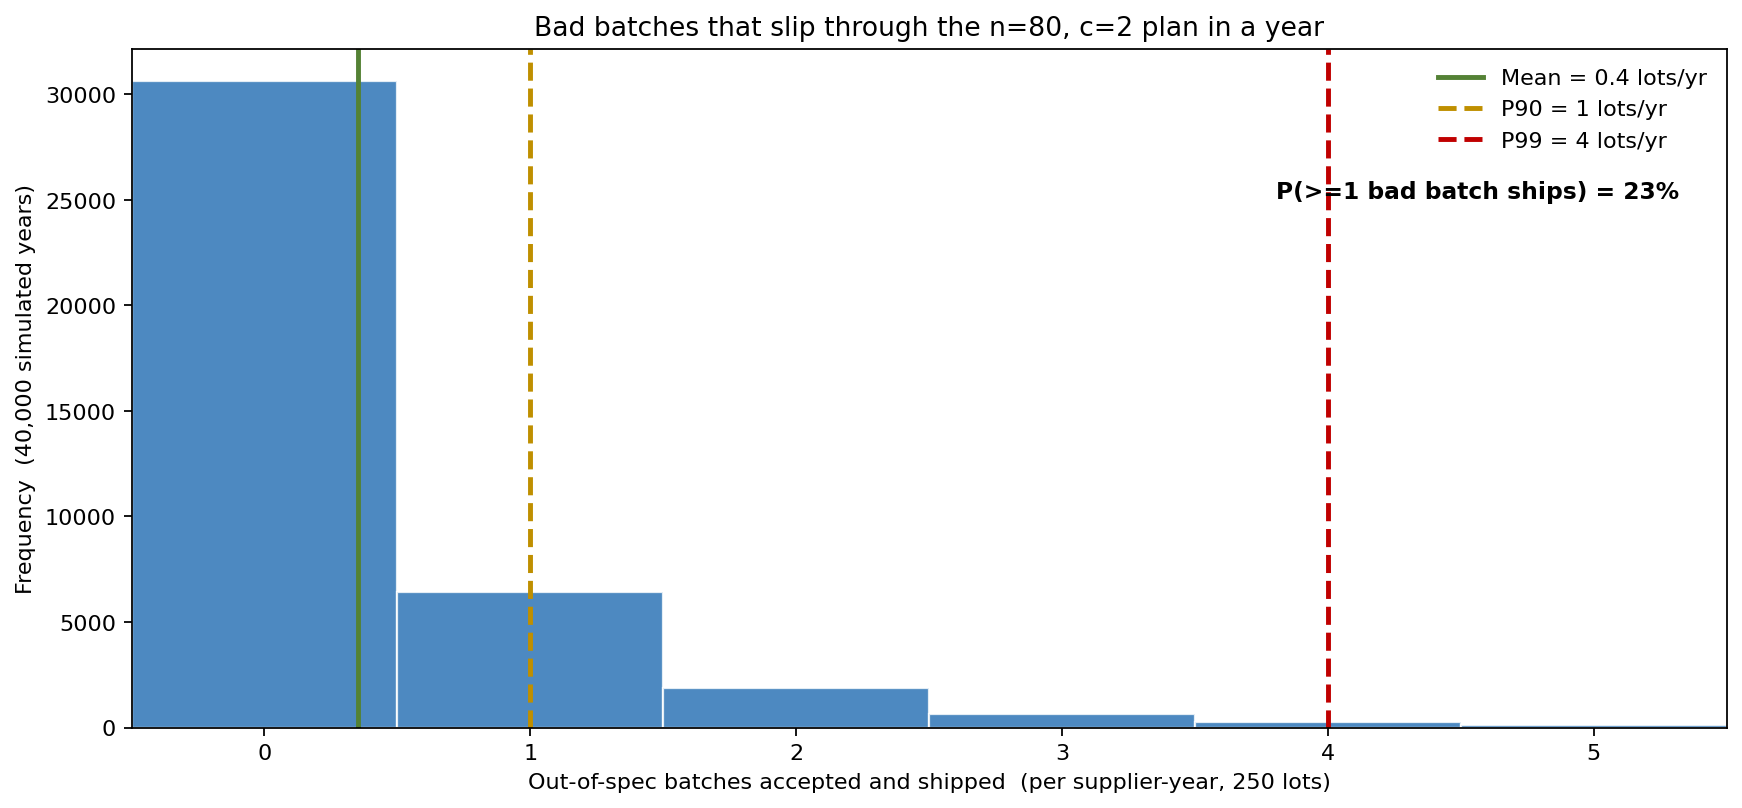
Most years the plan ships zero bad batches — the median is 0 and the mean is 0.35 lots per year. But the distribution has a right tail the average hides: the P90 is 1 bad batch, the P99 is 4, and the probability of at least one escape in a year is 23%. One escaped lot in a contamination-sensitive category is enough to trigger a customer audit. The point of the model is that this risk was baked into the sampling plan from the start, not introduced by an unlucky inspector.
Why a single accept/reject number can't tell you the risk
An acceptance-sampling plan is a filter with a known, smooth response to lot quality — the operating-characteristic (OC) curve. It is not a switch that passes good lots and stops bad ones; it is a probability that rises and falls with the lot's true defect rate. A pass/fail log records the realised decisions but never reconstructs that curve, so it cannot answer the two questions that actually matter: how often does the plan reject a perfectly good lot, and how often does it accept a bad one?
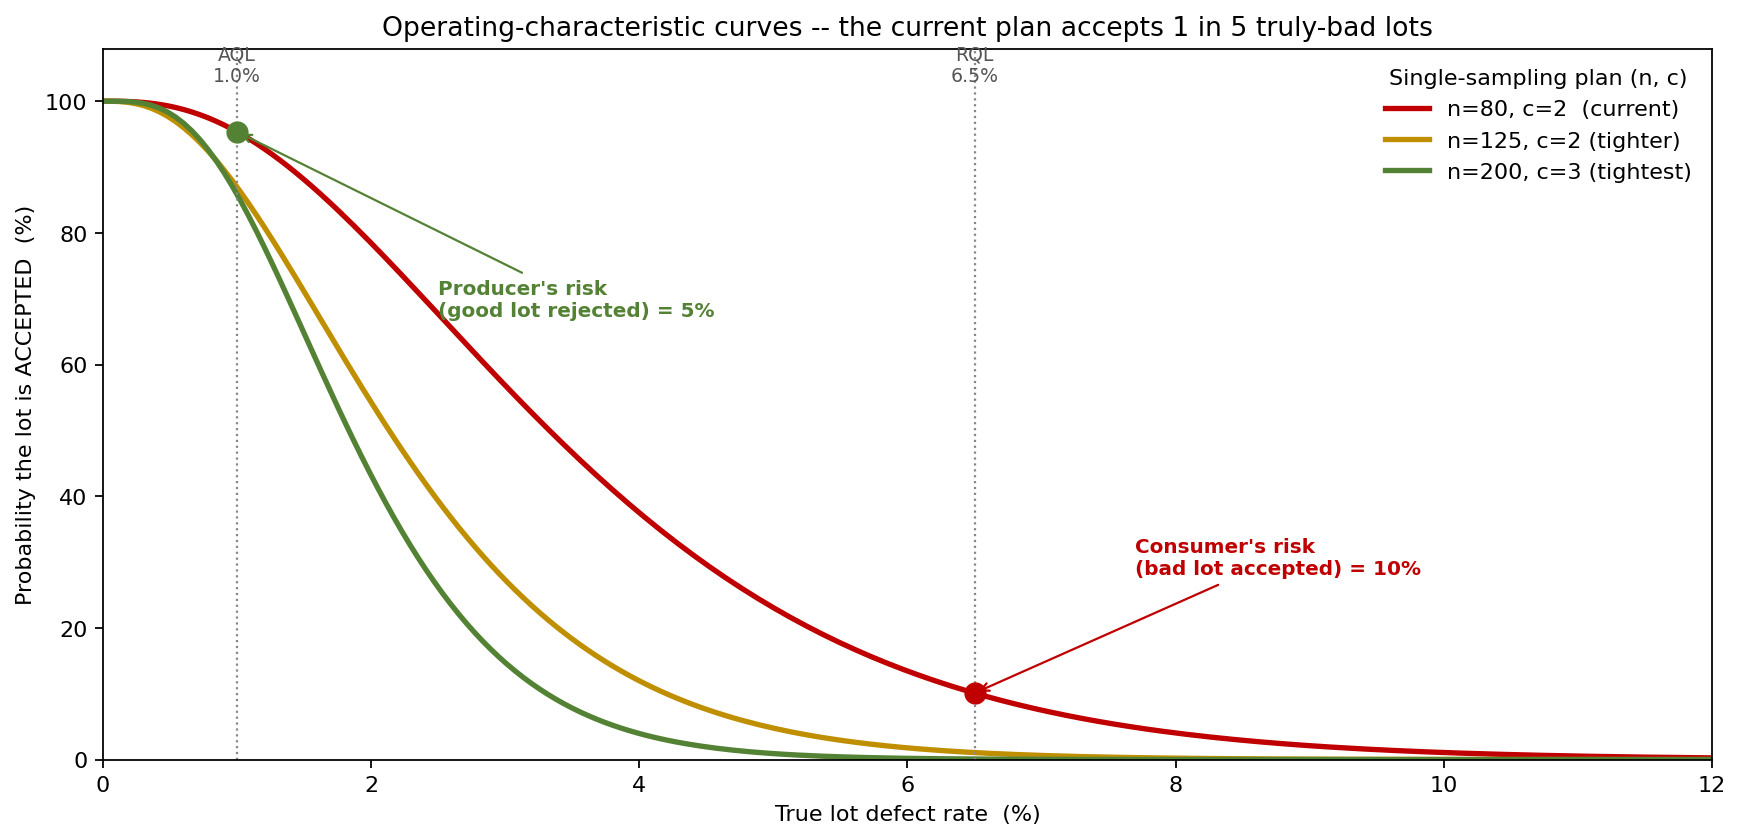
The OC curves make both risks explicit. For the current n=80, c=2 plan:
- Producer's risk — a good lot at the 1.0% AQL is rejected 4.7% of the time. Acceptable.
- Consumer's risk — a bad lot at the 6.5% RQL is accepted 10% of the time. This is the number a pass/fail log can never surface.
Tightening to n=125, c=2 cuts consumer's risk from 10% to 1.1%, at the cost of lifting producer's risk to 13%. The tightest plan, n=200, c=3, drives consumer's risk to 0.1%. The curve is the whole trade-off in one picture: there is no free inspection, only a choice about which error you would rather make.
Which lever actually moves the escape risk
Before buying more inspection, the team ranked what drives the consumer's-risk number, perturbing each plan parameter and measuring the effect on the probability of accepting a 6.5%-defective lot.
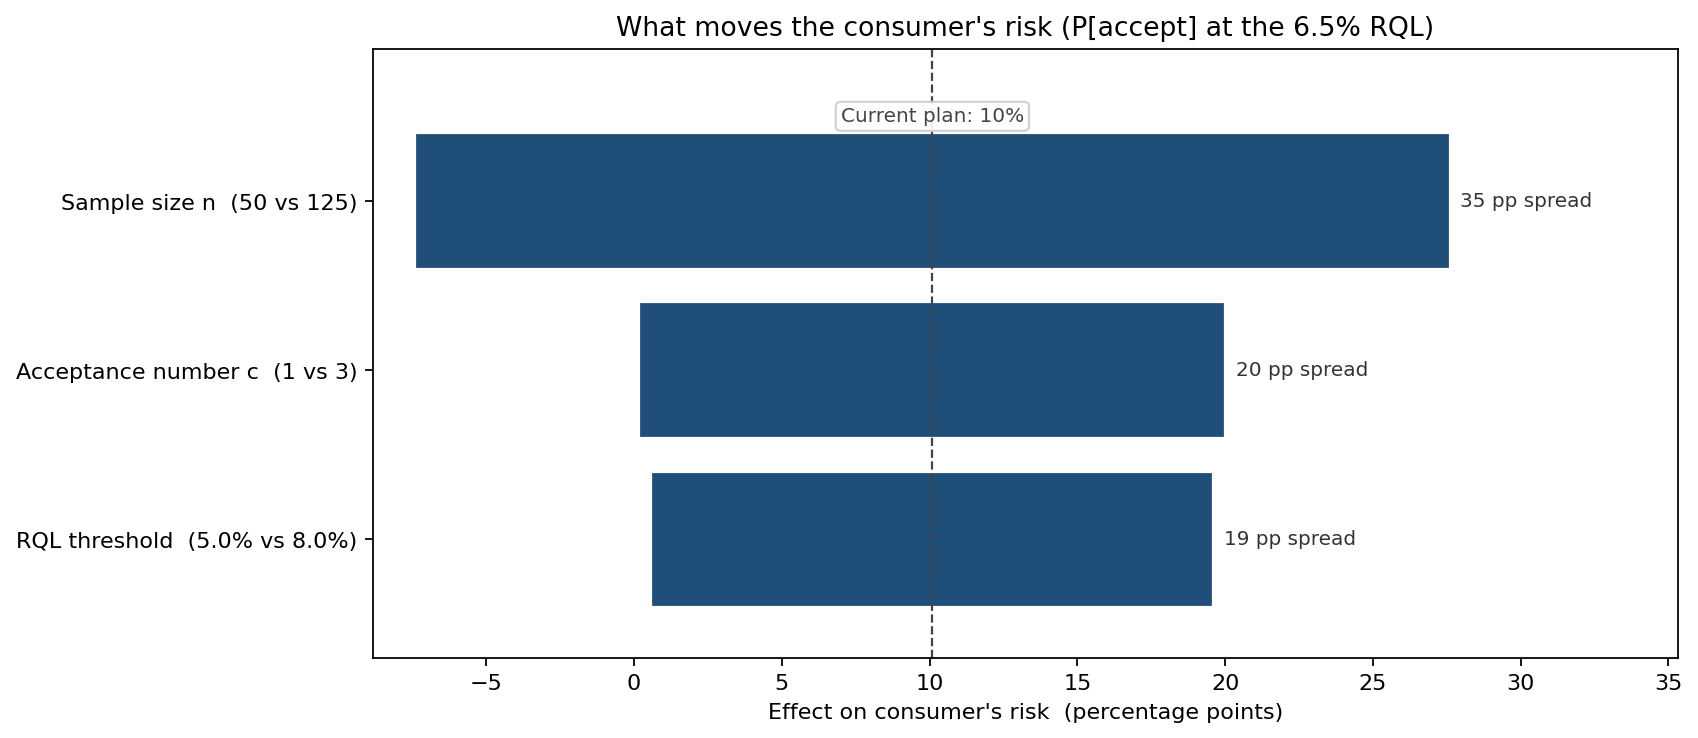
Sample size dominates. Moving n between 50 and 125 swings consumer's risk by 17.5 percentage points around the 10% baseline — far more than the acceptance number c (a 9.9 pp half-spread) or the choice of where to set the RQL threshold itself (9.5 pp). The practical reading: the cheapest reliable way to stop accepting bad lots is to inspect more units, not to argue about the cut-off count.
How much inspection buys down the annual escape risk
Holding the acceptance number at c=2 and sweeping only the sample size, the model traces the annual escape probability — the chance that at least one truly-bad batch ships in a 250-lot year — as a function of how many units are inspected per lot.
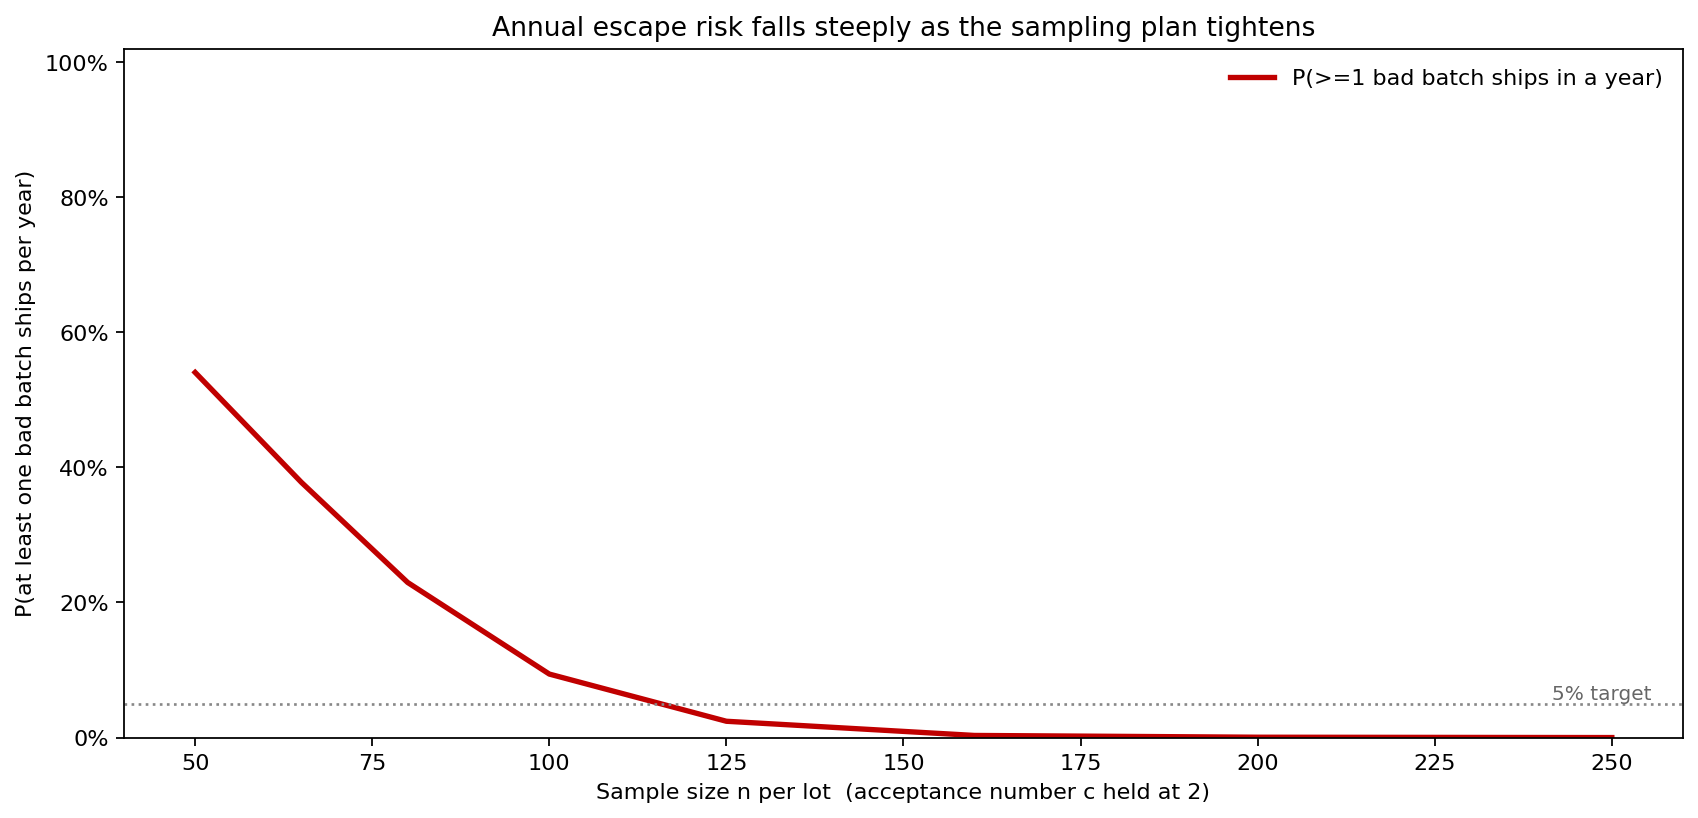
The curve falls steeply. At the current n=80, annual escape risk is 23%. Raising the sample to n=100 cuts it to 9%; n=125 reaches 2.4%, comfortably under a 5% tolerance line; n=200 all but eliminates it at 0.2%. The diminishing-returns elbow is visible — beyond n≈150 each extra inspected unit buys very little — which is exactly the information a fixed plan never reveals.
What the model changed
- The plan was retargeted to a risk, not a habit. The team moved from n=80, c=2 to n=125, c=2, cutting annual escape risk from 23% to 2.4% and consumer's risk per bad lot from 10% to 1.1%, while accepting the modest rise in good-lot rejections.
- Inspection spend was pointed at sample size. The tornado showed n carrying a 17.5 pp half-spread versus c's 9.9 pp, so the budget went to inspecting more units per lot rather than re-litigating the acceptance count.
- The escape risk became a reportable number. "23% chance of shipping a bad batch this year" reframed the quality review from counting rejected lots to managing a quantified consumer's risk — a number suppliers and customers could both see.
ModelRisk Functionality Used
- Binomial OC-curve construction across a continuum of true lot defect rates, producing the 4.7% producer's risk and 10% consumer's risk of the current plan and the full trade-off for two tighter plans.
- 40,000-trial supplier-year simulation with an uncertain per-supplier quality level (Beta) and correlated per-lot rates around it, giving the mean 0.35, P90 1, P99 4 distribution of bad batches shipped per year.
- Common-random-number plan comparison that re-ran the same simulated supplier-years under n=80/125/200, isolating the plan effect and showing annual escape risk falling from 23% to 2.6% to 0.1%.
- Tornado on consumer's risk ranking sample size (17.5 pp) above acceptance number (9.9 pp) and RQL definition (9.5 pp).
- Sample-size sweep mapping annual escape probability against n and exposing the diminishing-returns elbow past n≈150.
Acceptance sampling does not stop bad lots — it assigns each one a probability of getting through, and Monte Carlo is what turns that probability from an invisible property of the plan into a number you can manage.