

Industry: Agriculture and Food Supply Chain
Product: ModelRisk
Application: Optimizing food distribution under uncertainty
A 95% Average Fill Rate That Misses Target One Day in Three
A regional distribution centre ships roughly 18,000 cases of fresh produce a day across forty refrigerated loads. The operating dashboard reports a healthy average: 95.2% fill rate and a waste figure management is comfortable with. Run the same operation as a Monte Carlo simulation — daily demand drawn from a LogNormal, transit times Triangular, spoilage rising with cold-chain dwell — and the averages turn out to be the least useful numbers on the page. The fill rate falls below 95% on 36% of operating days, and the daily waste rate, which averages 12.4%, reaches 17.5% at the P90 and 24.1% at the P99. The good average is the arithmetic of many ordinary days cancelling out a long tail of bad ones.
That tail is not noise. A bad day is not "a slightly worse average day" — it is a day when a shared network-wide delay (congestion, weather, a depot bottleneck) pushes every load's transit time up at once, so spoilage and missed delivery windows arrive together across the whole fleet. The point estimate prices none of this, because it was built on the one number — the mean — that hides it.
The daily waste rate has a long right tail
The headline is the full distribution of daily waste, not its average:
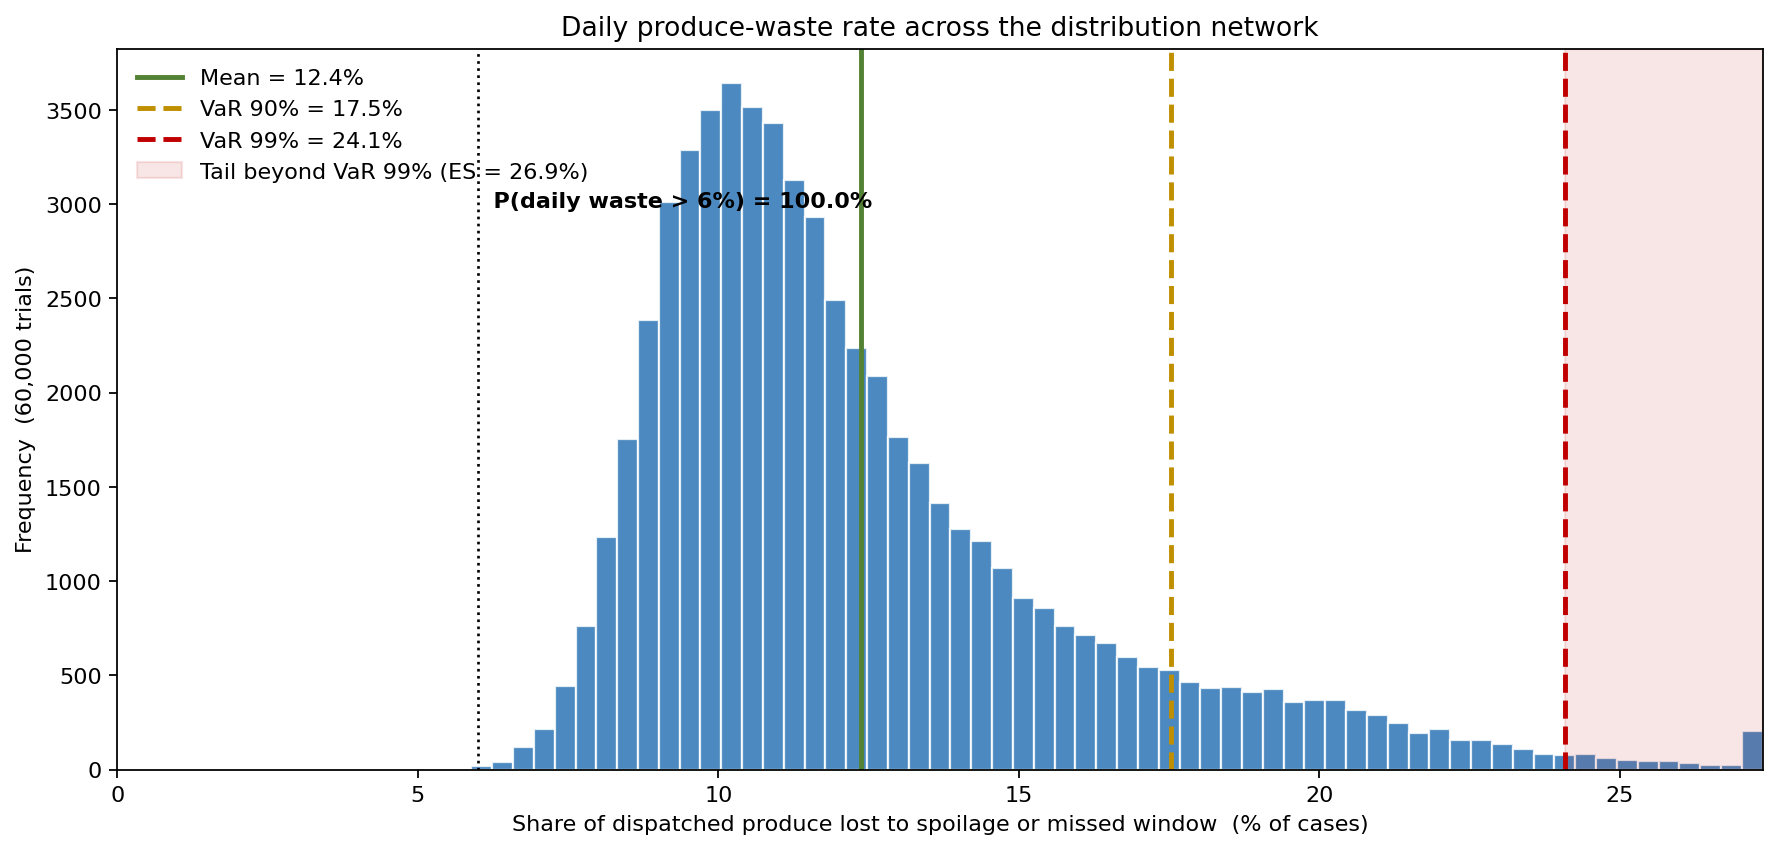
The mean daily waste rate is 12.4%, but the distribution is right-skewed: the P90 is 17.5%, the P99 is 24.1%, and the worst 1% of days (the expected shortfall beyond the P99) average 26.9%. A waste budget set to the mean is breached on roughly half of all days and is nowhere near the tail that drives the annual write-off. The distinction the chart forces is between "we waste about 12% of produce" and "one day in ten we waste more than 17.5%, and the bad days cluster" — and only the second is a number an operations director can plan stock and markdown capacity against.
Why a point estimate fails here
A single average waste rate, or a single fill-rate target, collapses two facts a perishable network cannot afford to lose. First, the spread: demand, transit time and reefer-unit performance each vary day to day, so the realised outcome swings far more than the average suggests. Second, the coupling: the days that spoil product are also the days that miss delivery windows, because both are driven by the same long-transit events. A deterministic plan treats waste and service as independent line items and sizes neither for the days when they fail together.
Sizing the service buffer is a genuine trade-off
The lever the DC actually controls is how much produce to ship above forecast demand. A larger buffer lifts the fill rate (more product on the shelf) but raises waste (surplus perishes on low-demand days). Sweeping the buffer turns the question into a readable trade-off:
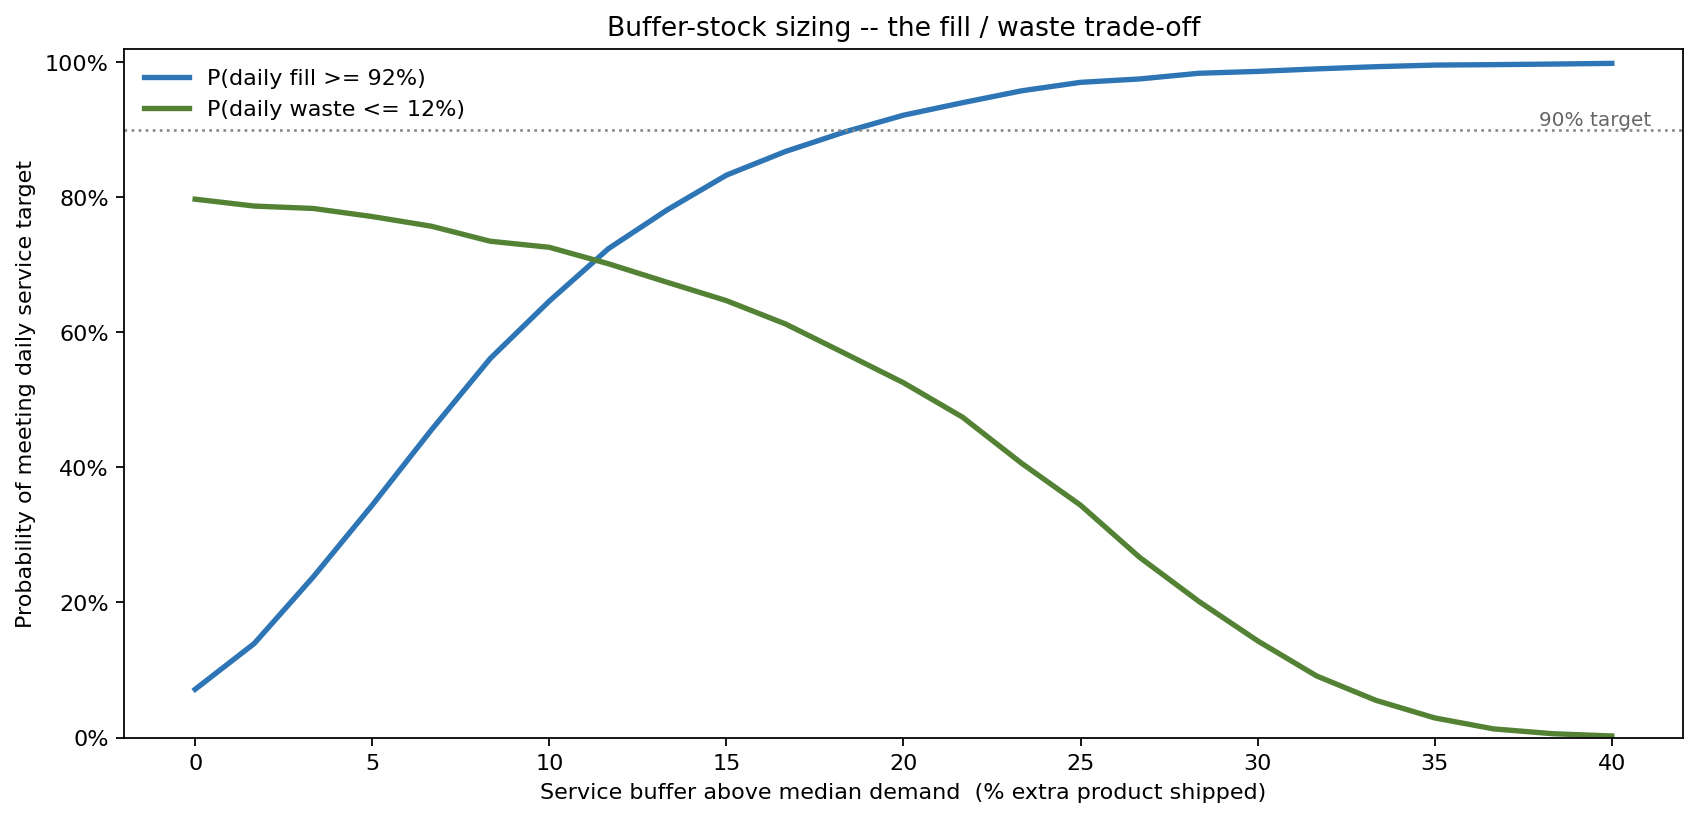
At no buffer, the probability of meeting a 92% fill target is just 7%; pushing the buffer to +25% raises it to 97% — but the probability of holding daily waste at or below 12% collapses from 80% to 34% over the same range. The two curves cross at about +12% extra product shipped, where each target is met on roughly 70% of days. That crossover is the finding: there is no buffer that makes both targets near-certain, so the choice is an explicit risk appetite — accept more waste to protect service, or accept more stockouts to protect margin — not a single "optimal" number.
Which uncertainty drives the worst days
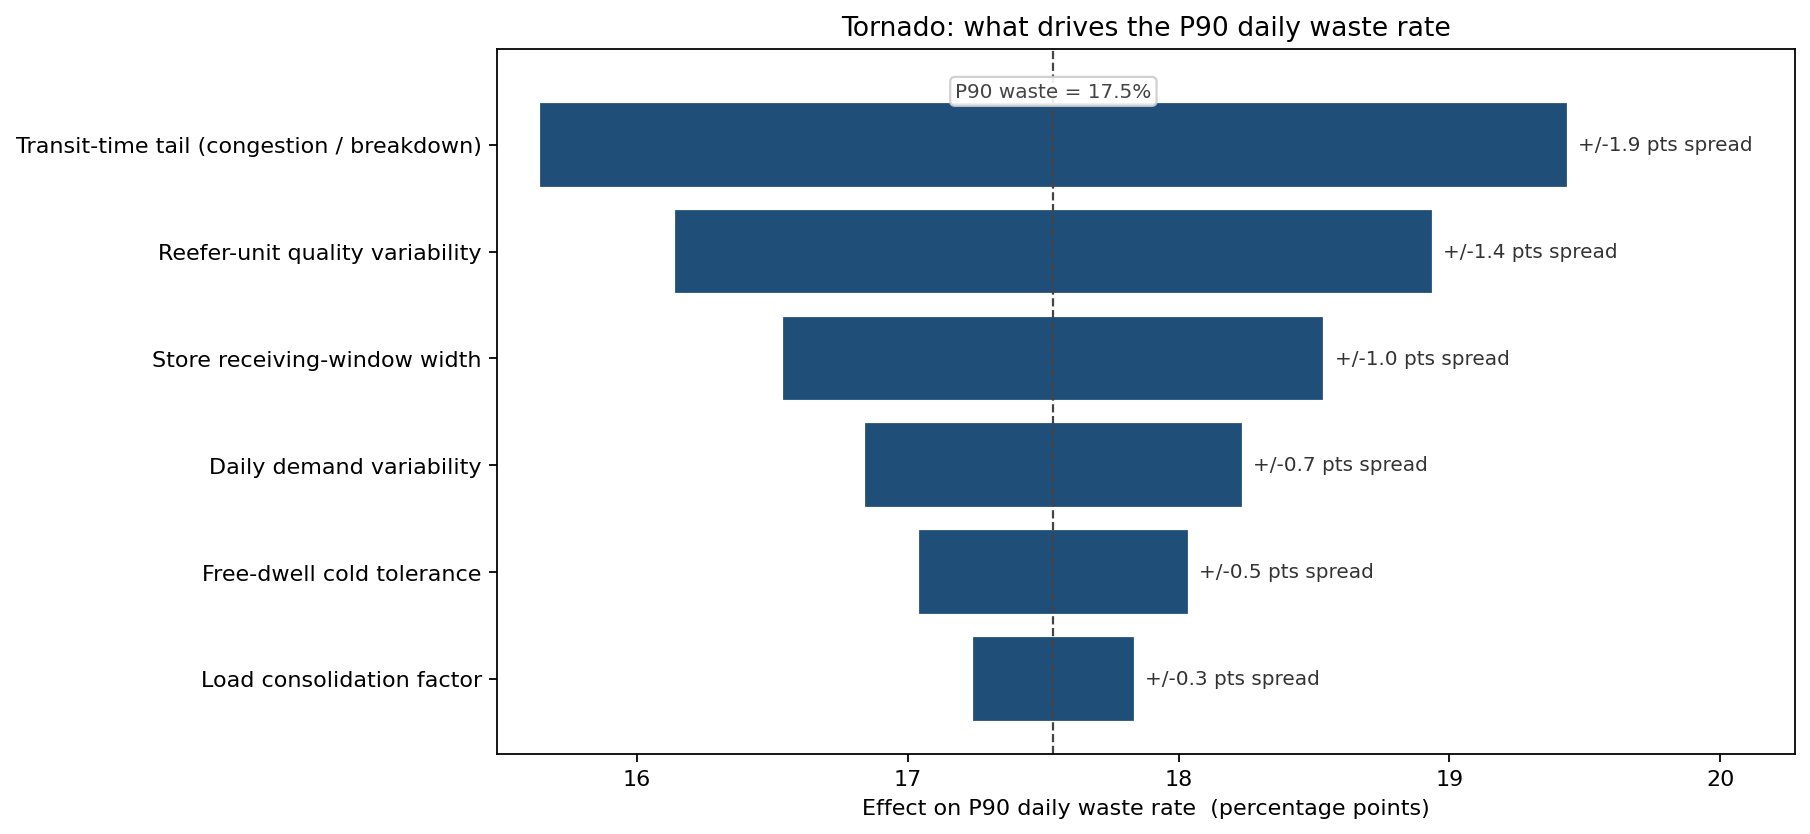
Ranking the inputs by their effect on the P90 waste rate (17.5%) puts the transit-time tail — congestion and breakdowns that extend cold-chain dwell — at the top, ahead of reefer-unit quality and the store receiving-window width. Daily demand variability, the number most forecasting effort goes into, sits well down the list. This redirects investment away from ever-finer demand forecasts and toward the transit reliability and cold-chain integrity that actually own the tail.
The bad days are bad on both axes
Waste and fill rate are not independent. The same long-transit days that spoil product also miss delivery windows, so the worst outcomes cluster in one corner:
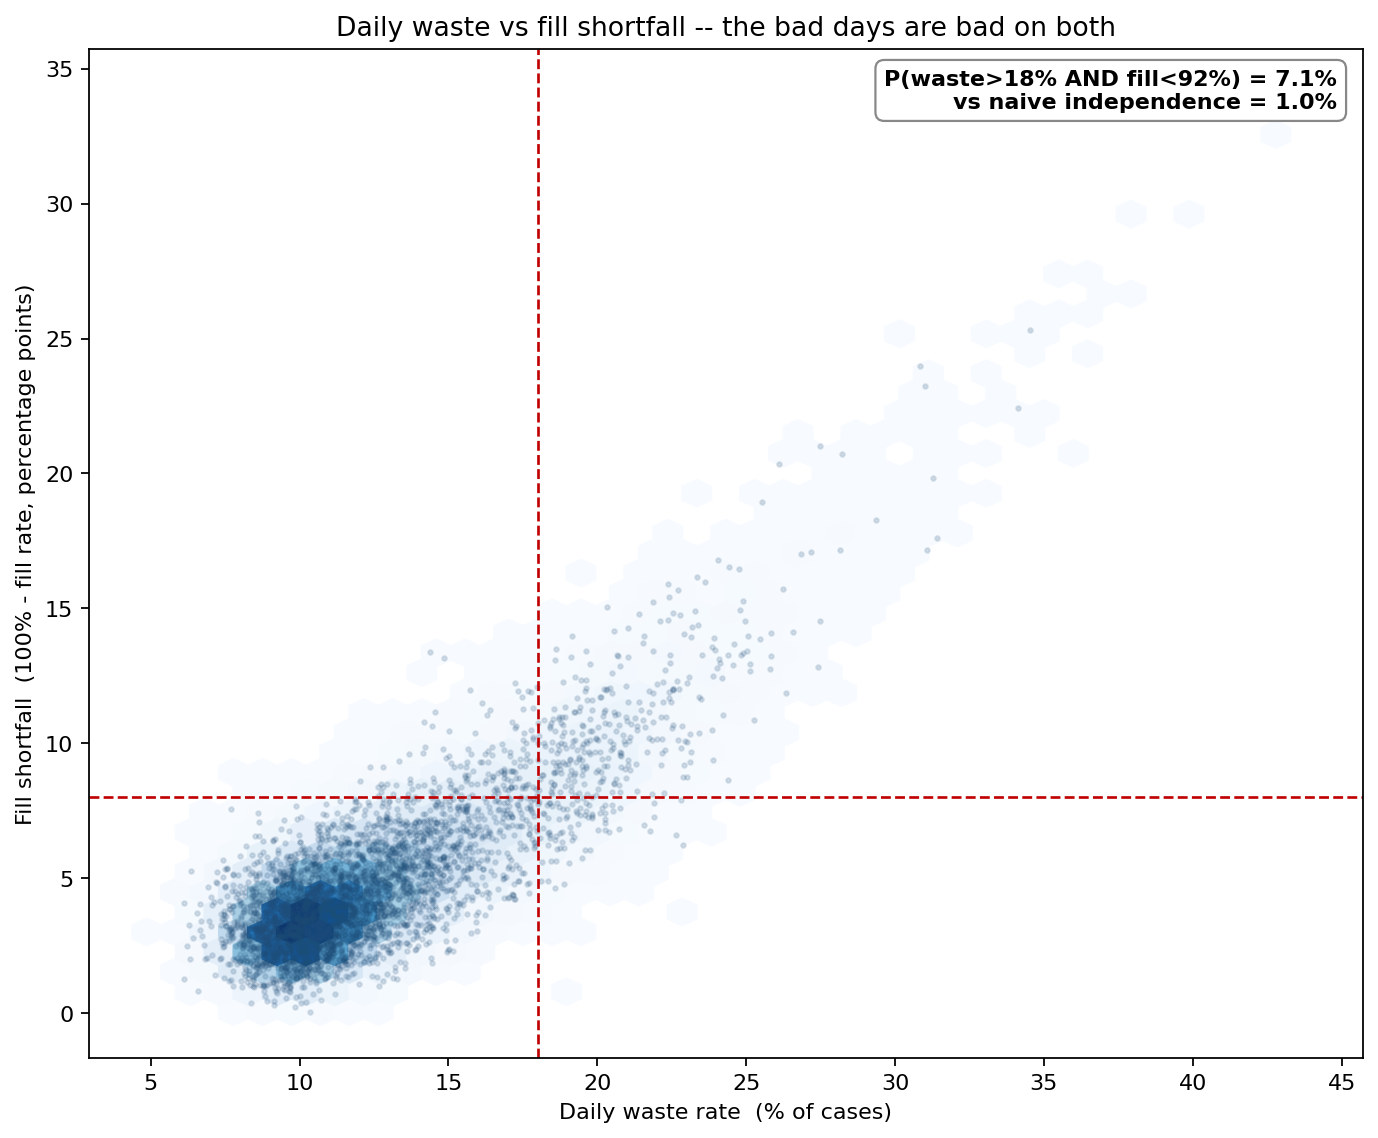
The probability of a day that is both high-waste (above 18%) and low-fill (below 92%) is 7.1%. If you assumed waste and fill were independent — as separate dashboard tiles invite you to — you would multiply their marginal probabilities and get just 1.0%. The real joint risk is seven times the independence estimate, with an empirical correlation of 0.81 between waste and fill shortfall. The crisis days the network must staff and stock for are precisely the ones a tile-by-tile dashboard says almost never happen together.
What the model changed
- The waste budget was re-anchored to the P90 (17.5%), not the 12.4% mean — ending a structural under-reserve of markdown and disposal capacity for the bad days.
- The service buffer was set at +12% by explicit choice at the fill/waste crossover, with the trade-off documented rather than buried in a single fill-rate KPI.
- Cold-chain and routing investment was prioritised over demand-forecasting spend, following the tornado's verdict that the transit-time tail drives the P90 waste.
- Bad-day staffing and markdown capacity were sized for joint failure — the 7.1% of days that are simultaneously high-waste and low-fill — rather than for two independent 1-in-a-handful events.
ModelRisk Functionality Used
- LogNormal daily demand and Triangular transit times feeding a dwell-dependent spoilage curve — the variability the average conceals.
- A shared per-day logistics shock applied across the whole fleet, so the day-level distribution keeps a genuine right tail instead of collapsing to the mean under the law of large numbers.
- A service-buffer threshold sweep turning "how much should we ship above forecast?" into two crossing probability curves with a readable optimum.
- Sensitivity tornado ranking transit reliability, reefer quality and demand variability by their effect on the P90 waste rate.
- Joint-density output quantifying the dependence between waste and fill — showing the joint bad-day risk is seven times the independence assumption.
A distribution plan built on a 95% average fill rate is a claim that the average day is the day you need to manage. Monte Carlo simulation in ModelRisk replaces that claim with a distribution — turning "we run at 95% fill and 12% waste" into "one day in three misses the fill target, one day in ten wastes more than 17.5%, and those days arrive together; here is the +12% buffer that balances them."