

Industry: Agriculture and Food Supply Chain
Product: ModelRisk
Application: Fertilizer Optimization
The "Optimal" 195 kg/ha Nitrogen Rate That Is Wrong 96% of the Time
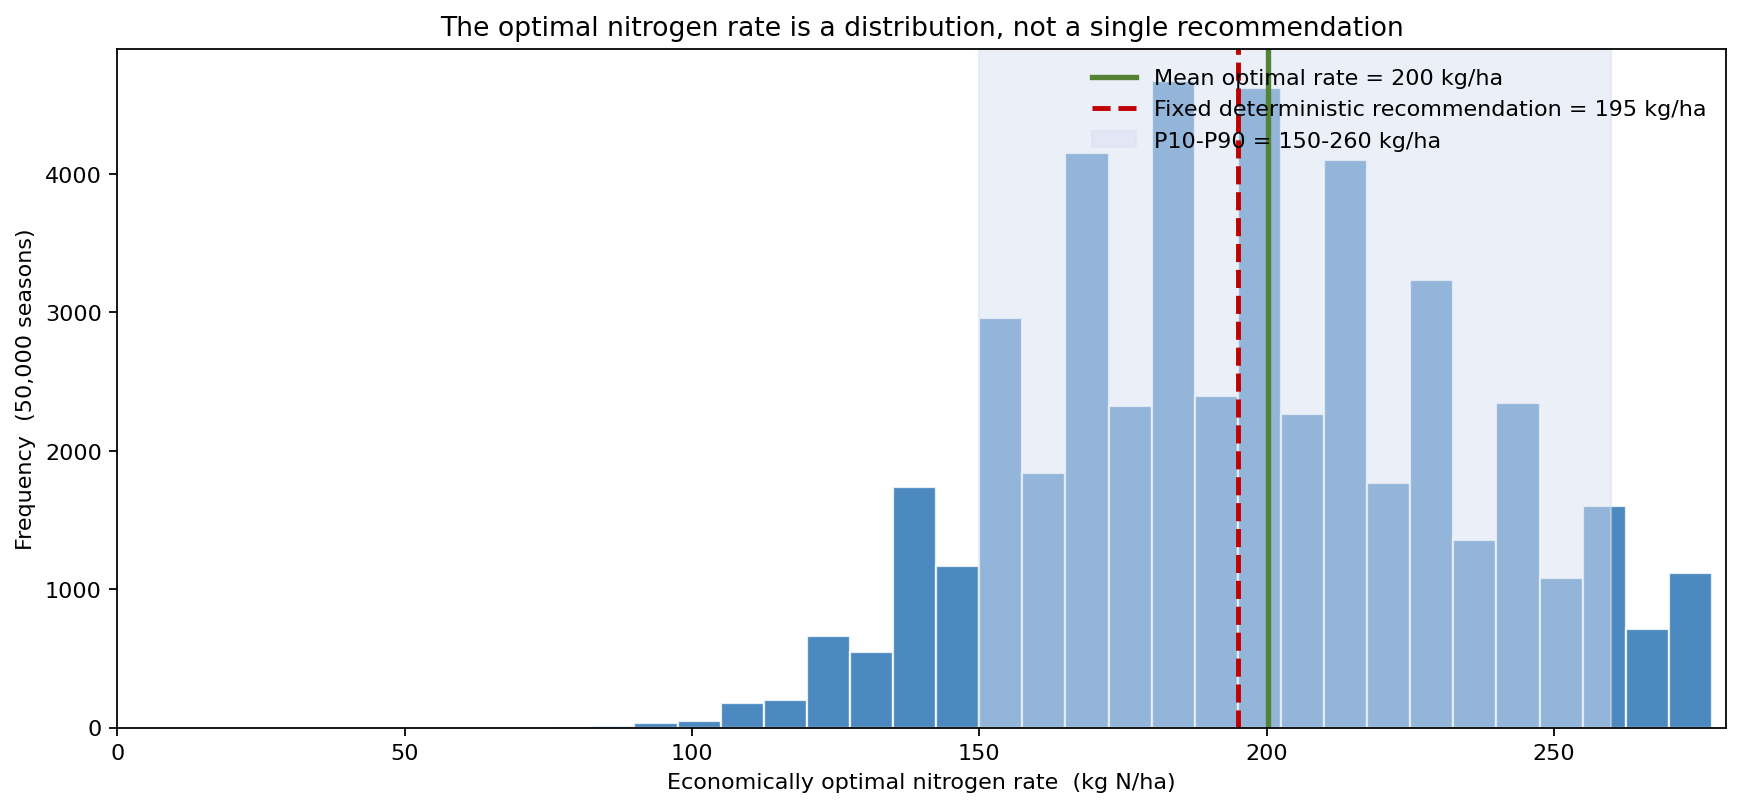
An agronomist's fertilizer recommendation is a single number: apply 195 kg of nitrogen per hectare. It is the rate that maximizes net margin for the average yield-response curve at average prices, and on a spreadsheet it looks authoritative. Run the season 50,000 times, though, letting the yield-response curve, the grain price, and the nitrogen price all vary the way they actually do, and the economically optimal rate turns out to be a distribution spanning 150 to 260 kg/ha at the P10–P90, with a mean of 200 kg/ha. The fixed 195 kg/ha recommendation lands on the season-specific optimum in only a handful of percent of seasons — in 46% of seasons it over-applies (wasting nitrogen and raising leaching risk) and in 50% it under-applies (leaving yield, and margin, in the field).
The agribusiness used Vose Software's ModelRisk to treat the optimal nitrogen rate as the random variable it really is, to quantify the margin and environmental cost of a one-size-fits-all rule, and to show how the optimum slides with grain price so that variable-rate decisions could be made on evidence rather than a single agronomic table.
Why a point estimate fails here
The standard approach plugs mean values into a Mitscherlich yield-response curve, finds the margin-maximizing rate, and writes it on the recommendation sheet. The flaw is structural, not a matter of better averages: the optimal rate is a nonlinear function of several uncertain inputs, and the optimum of an average is not the average of the optima. A high-yield-potential season with strong grain prices wants more nitrogen; a drought year with a flat response curve wants far less. Collapsing all of that into one number does not hedge the uncertainty — it simply picks a rate that is exactly right for a season that almost never occurs.
The chart above shows the consequence. The fixed deterministic recommendation (red dashed line at 195 kg/ha) sits inside a broad distribution of season-specific optima that runs from below 120 to the 280 kg/ha ceiling. The shaded P10–P90 band of 150–260 kg/ha is over 100 kg of nitrogen wide. There is no single rate that is "the" answer — the honest answer is the spread, and the decision the spread implies is adjust the rate to the season, not memorize one number.
Modeling the yield response and its uncertainty
Yield response to nitrogen is modeled with the Mitscherlich curve Y(F) = Ymax x (1 - exp(-k x (F - Fmin))), with every parameter uncertain and re-drawn each season:
- Maximum yield
Ymax— Normal, mean 12.5 t/ha, then scaled by a shared seasonal growing-condition factor so a good or poor year lifts or depresses the whole field's potential at once. - Response coefficient
k— LogNormal, governing how fast yield approaches its ceiling (the strength of diminishing returns). - Minimum nitrogen
Fmin— Triangular, the threshold below which there is no response. - Grain price — LogNormal (σ = 0.22), mean $230/t, P10–P90 of $170–$298.
- Nitrogen price — LogNormal, mean $1.45/kg.
The shared growing-condition factor is the key modeling choice: because it scales the whole field's Ymax together, season margins do not diversify away into a tidy Gaussian average — a poor season is poor across the board, keeping the margin distribution genuinely spread. For each of the 50,000 seasons the model searches the candidate nitrogen rates and records the rate that maximizes margin(F) = grain_price x Y(F) - n_price x F - fixed cost, producing the optimal-rate and optimal-margin distributions.
What a fixed rate costs: the margin distribution
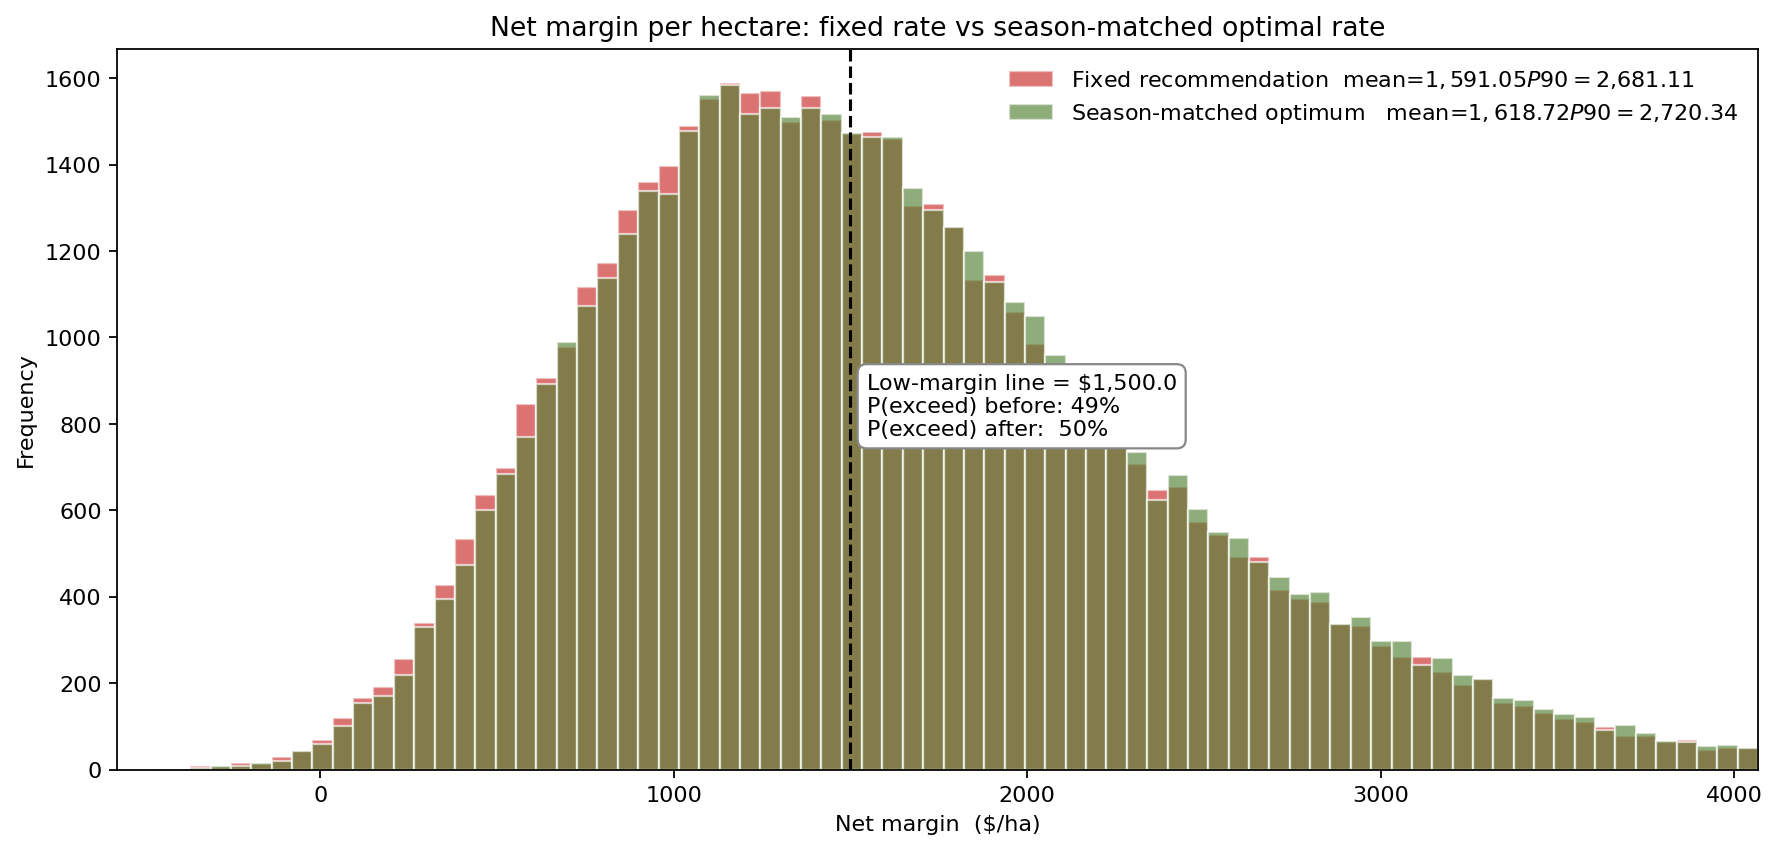
Comparing the per-hectare net margin from always applying the fixed 195 kg/ha against the season-matched optimum isolates the value of getting the rate right. The season-matched optimum lifts mean margin from $1,591/ha to $1,619/ha and raises the P10 floor from $652 to $671/ha. The average gain is modest — about $28/ha — because the Mitscherlich curve is flat near its peak, so being a little off the optimum costs little on average. But the foregone margin is itself right-skewed: in the worst seasons it reaches a P99 of $207/ha, and across 10,000 hectares even the mean gain is roughly $280,000 a year recovered simply by matching the rate to conditions. The flat-topped margin curve is exactly why a deterministic model feels "good enough" — and exactly why the real prize is in the tail seasons and in the nitrogen not wasted.
Why the optimum moves: probability of clearing a margin target
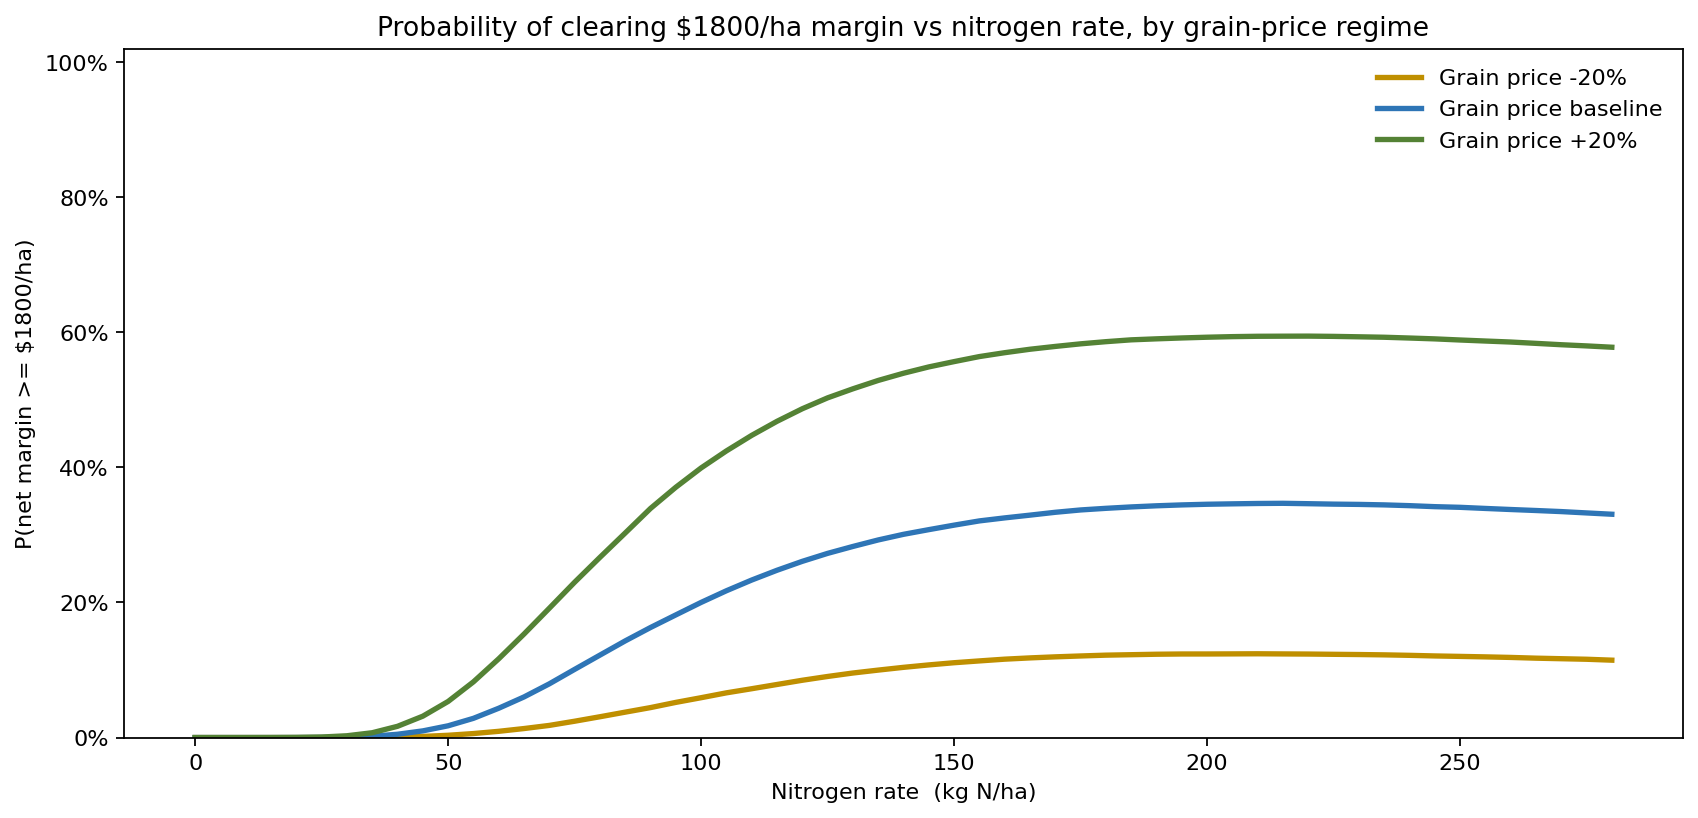
Sweeping the probability of clearing an $1,800/ha margin target across nitrogen rates, under three grain-price regimes, shows directly why a fixed rate misfires. The rate that maximizes the chance of hitting the target slides upward with grain price — from about 210 kg/ha in a low-price year to 220 kg/ha in a high-price year — and the achievable probability itself climbs from 12% to 35% to 59%. When grain is dear, extra nitrogen pays for itself and the optimum rises; when grain is cheap, the same nitrogen destroys margin and the optimum falls. A single recommendation cannot track that movement. The model lets the grower condition the rate on the price signal available at application time, capturing the upside in strong-price years without over-applying in weak ones.
What actually drives margin
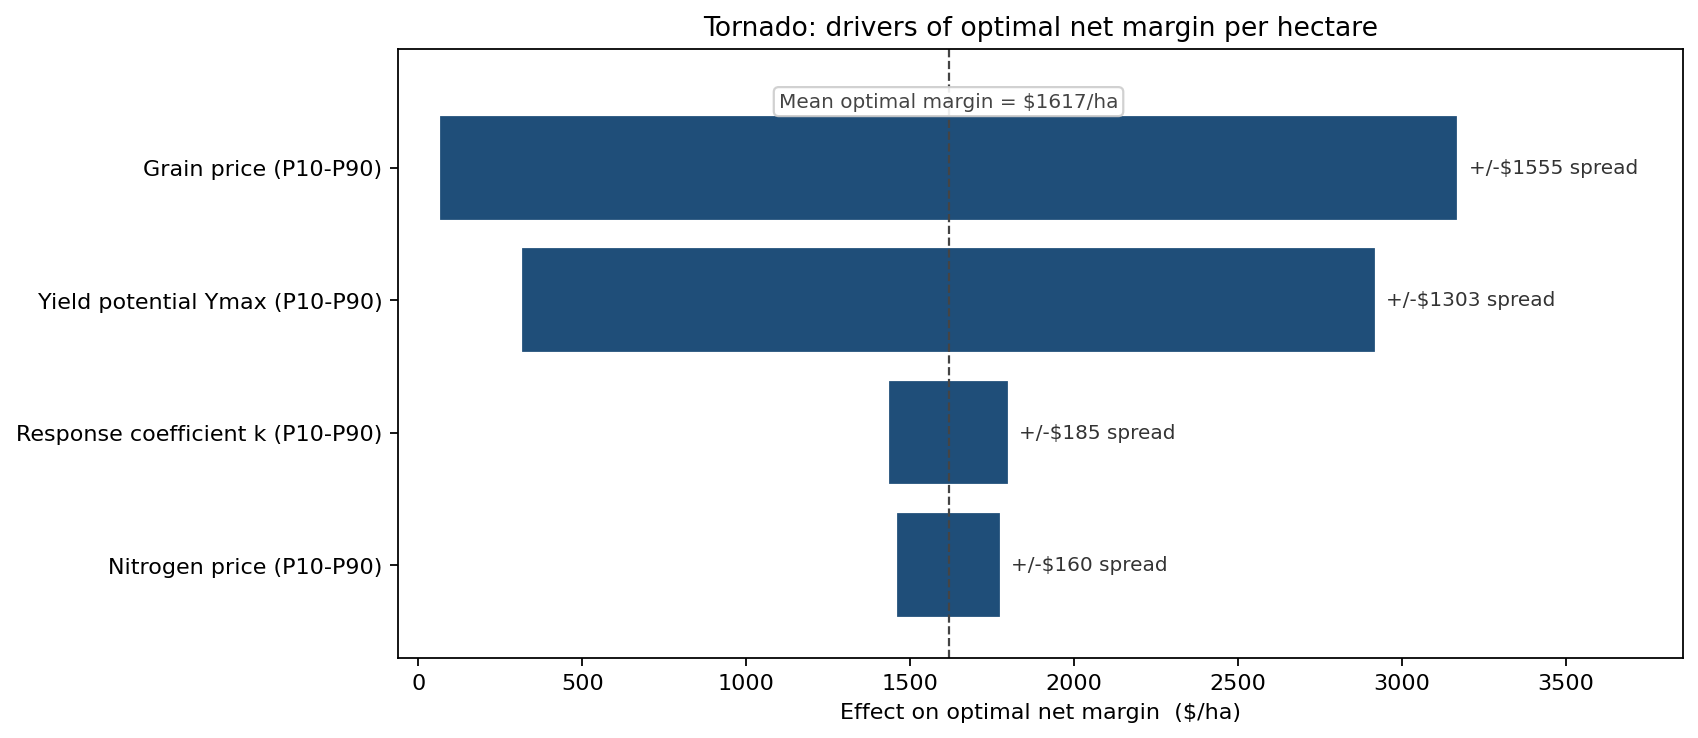
Swinging each input from its P10 to its P90 with the others held central, grain price dominates with a +/-$778/ha swing in optimal margin, followed by yield potential Ymax (+/-$651/ha). The agronomic response parameters that recommendation tables obsess over — the response coefficient k (+/-$92/ha) and nitrogen price (+/-$80/ha) — are an order of magnitude smaller. The ranking reframed the problem: margin risk is overwhelmingly a market and weather story, not a fertilizer-agronomy story. The most valuable lever is not a more precise k from another trial plot, but the ability to adjust nitrogen to the grain price and the season's yield outlook.
What the model changed
- Recommendations became rate ranges tied to conditions. The agronomy team replaced the single 195 kg/ha figure with a price-and-season-conditioned band (roughly 150–260 kg/ha), and built a simple rule mapping the at-application grain price to a target rate.
- Over-application was cut where it mattered. Quantifying that the fixed rate over-applied in 46% of seasons — a mean ~14 kg/ha of excess nitrogen, P90 of 45 kg/ha — gave the environmental team a defensible basis to lower rates in low-yield-outlook fields, reducing leaching risk without a measurable margin penalty.
- Effort moved from agronomy to market signals. Because the tornado showed grain price and yield potential dwarfing the response coefficient, the company redirected investment from additional response-curve trials toward better in-season yield forecasting and price-linked decision rules.
- Margin was reported as a distribution to farm managers. Instead of a single expected margin, managers received the P10–P90 range per field, letting them see the downside seasons and plan working capital against the floor rather than the average.
ModelRisk Functionality Used
- Monte Carlo simulation across 50,000 seasons, re-optimizing the nitrogen rate against a freshly drawn yield-response curve and price set each iteration.
- A shared seasonal common factor scaling whole-field yield potential, keeping the margin distribution genuinely spread rather than averaging away.
- Distribution fitting — Normal yield potential, LogNormal response coefficient and prices, Triangular minimum-nitrogen threshold, with physical bounds enforced.
- Optimization across a rate grid identifying the margin-maximizing nitrogen rate per season and exposing it as a distribution.
- Scenario analysis comparing a fixed deterministic rate against the season-matched optimum and sweeping the optimum across grain-price regimes.
- Tornado sensitivity analysis ranking grain price and yield potential above the agronomic response parameters and redirecting analytical effort.
The optimal fertilizer rate is not a number on a recommendation sheet — it is a distribution that moves with the weather and the market. A deterministic plan picks the rate that is right for an average season and is therefore wrong for almost every real one. Monte Carlo simulation is what turns "apply 195 kg/ha" into "here is the rate this season's conditions and prices actually call for, and here is what guessing costs."