

Industry: Agriculture and Food Supply Chain
Product: ModelRisk
Application: Crop Disease Modeling
The Expected Loss Was GBP 2.7M. The Loss the Region Should Plan For Was GBP 28M
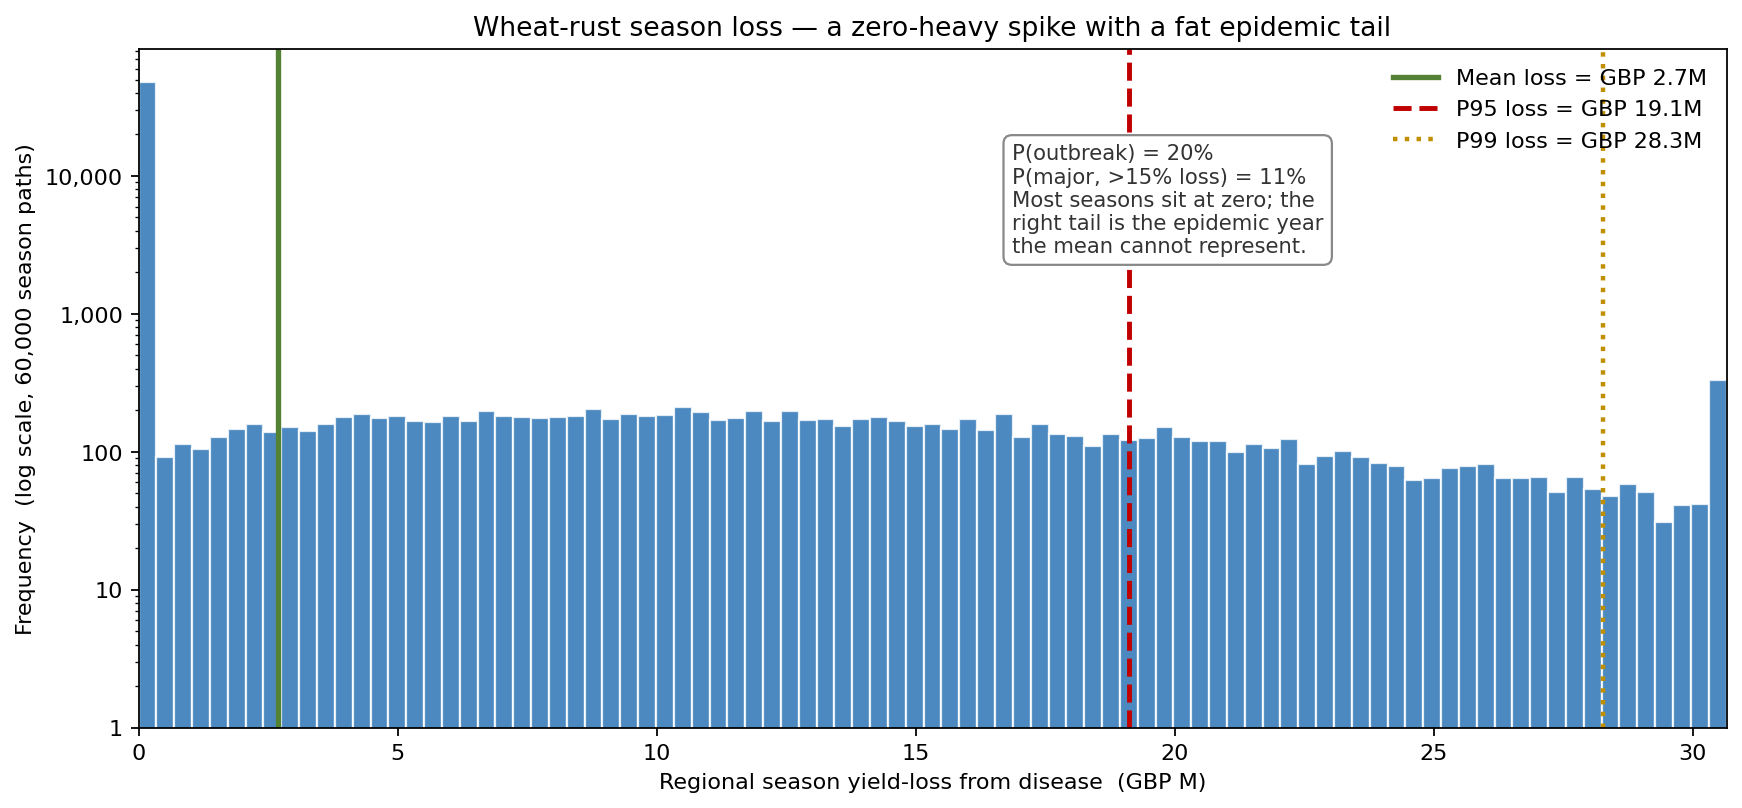
A producer carries GBP 73.6M of wheat at risk across a 40,000-hectare region (8.0 t/ha at GBP 230/t). Asked "what is our rust exposure?", the deterministic risk sheet multiplies an outbreak probability by an average yield-loss and returns an expected monetary loss of GBP 2.7M. That single number is technically the mean — and it is useless for the decision in front of management, because no season ever loses GBP 2.7M. Most seasons lose nothing at all; the rare epidemic year loses an order of magnitude more.
Simulate 60,000 seasons in ModelRisk and the true shape appears. The disease ignites in only 20% of seasons, and a major outbreak (>15% regional yield loss) occurs 11% of the time — but when it does, the loss runs to a P95 of GBP 19.1M and a P99 of GBP 28.3M. The question is not "what is the average loss" but "can the balance sheet absorb the one-in-twenty year", and that question the GBP 2.7M mean cannot even pose.
Why a point estimate fails here
Crop disease is a frequency-severity process, and frequency-severity processes are exactly where a mean misleads most. The loss distribution is a tall spike at zero (no epidemic) welded to a long right tail (a runaway epidemic), and the mean falls in the empty gap between them. Worse, a point model treats the outbreak probability and the loss-given-outbreak as fixed averages, when both are driven by the same seasonal weather — a warm, humid season raises the chance the disease ignites and the speed at which it then spreads.
The model captures this with a disease-favourability index (DFI), a logistic function of shared seasonal warmth and leaf-wetness (both Beta-distributed). Outbreak ignition is a Bernoulli whose probability rises with DFI; severity given ignition is a Beta whose mean climbs with DFI. The two compound, which is what produces the heavy upper tail a constant-probability model flattens away.
Mitigation value lives in the tail
Two interventions are on the table: a fungicide programme (caps how far an epidemic spreads — it attacks severity) and a resistant variety (cuts the chance an epidemic ignites at all — it attacks frequency). Comparing the total-cost distributions, loss plus the cost of the programme, shows why the mean is the wrong scorecard.
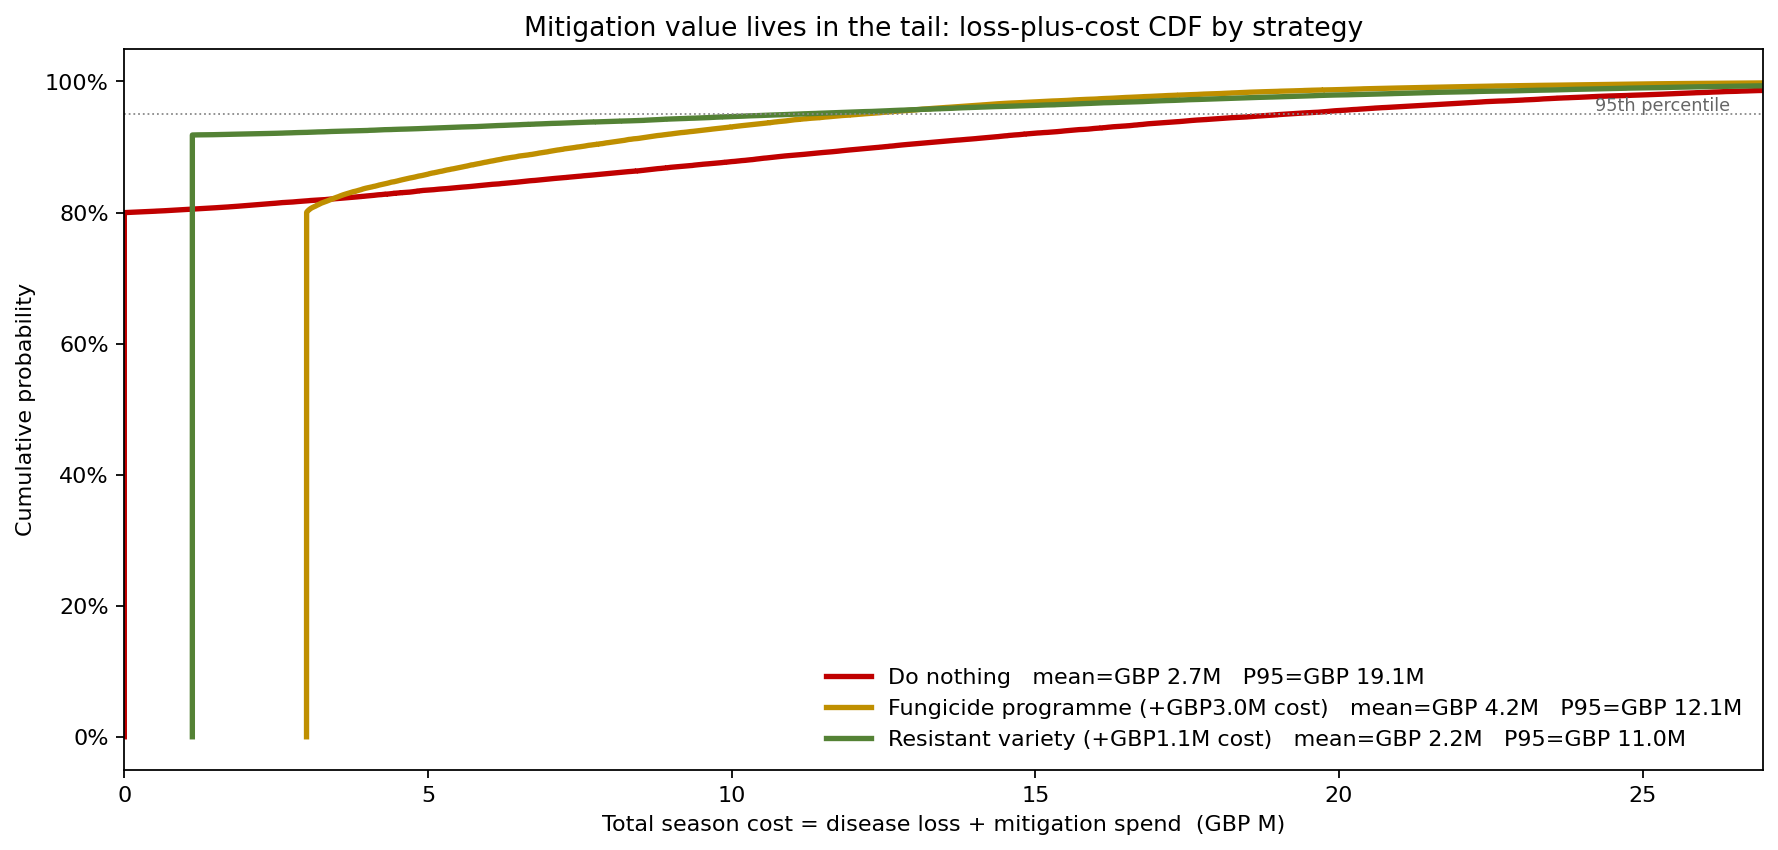
On the mean, the fungicide programme looks like a loser — it raises expected total cost from GBP 2.7M to GBP 4.2M, because in the 80% of seasons with no epidemic you simply pay for spray you did not need. But look at the tail it is bought for: fungicide cuts the P90 from GBP 12.5M to GBP 7.5M and the P99 from GBP 28.3M to GBP 21.0M. The resistant variety, attacking ignition, is stronger still — for a modest GBP 1.1M seed premium it pulls the P90 down to GBP 1.1M and the mean total cost below baseline at GBP 2.2M. A producer choosing on expected value alone would reject the very protection that caps the year that could break it.
What drives the loss
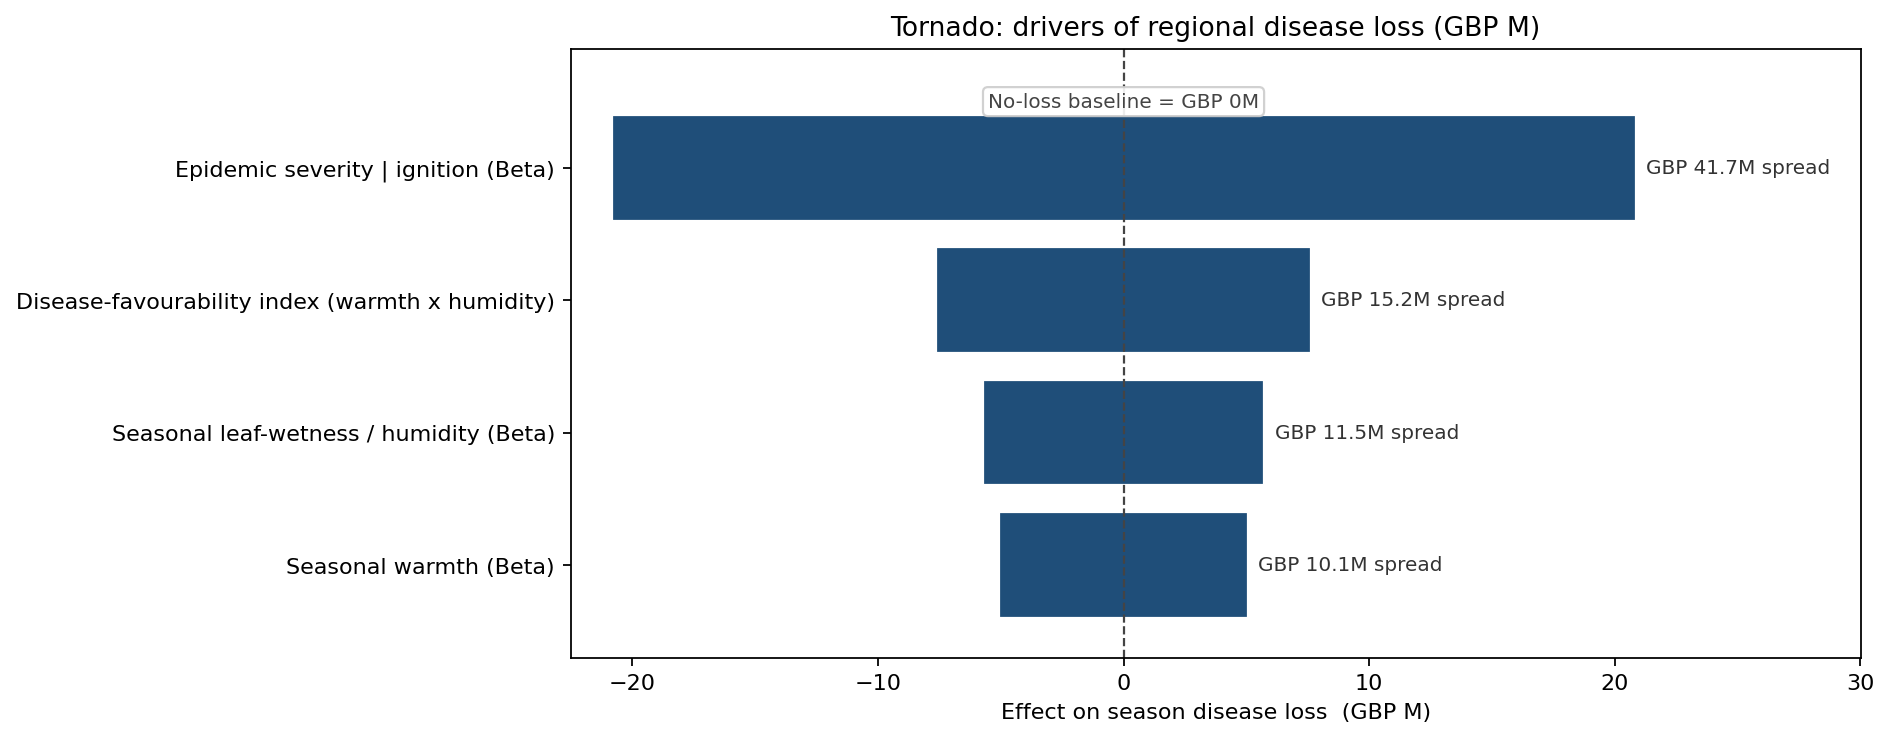
A single-draw sensitivity is meaningless here — moving one weather input alone almost never crosses the ignition threshold — so the tornado measures each driver's expected-loss swing: mean loss in the input's top quartile minus its bottom quartile. Epidemic severity given ignition dominates at a GBP 20.8M swing, confirming that the question "how bad once it starts" outranks "does it start". The disease-favourability index (GBP 7.6M), humidity (GBP 5.7M) and warmth (GBP 5.1M) follow. The ranking points R&D at spread-limiting genetics, not just at lowering infection odds.
When does the resistant variety earn its premium?
The resistant variety is not free, so the decision is conditional on the season: at what level of weather favourability does it pay?
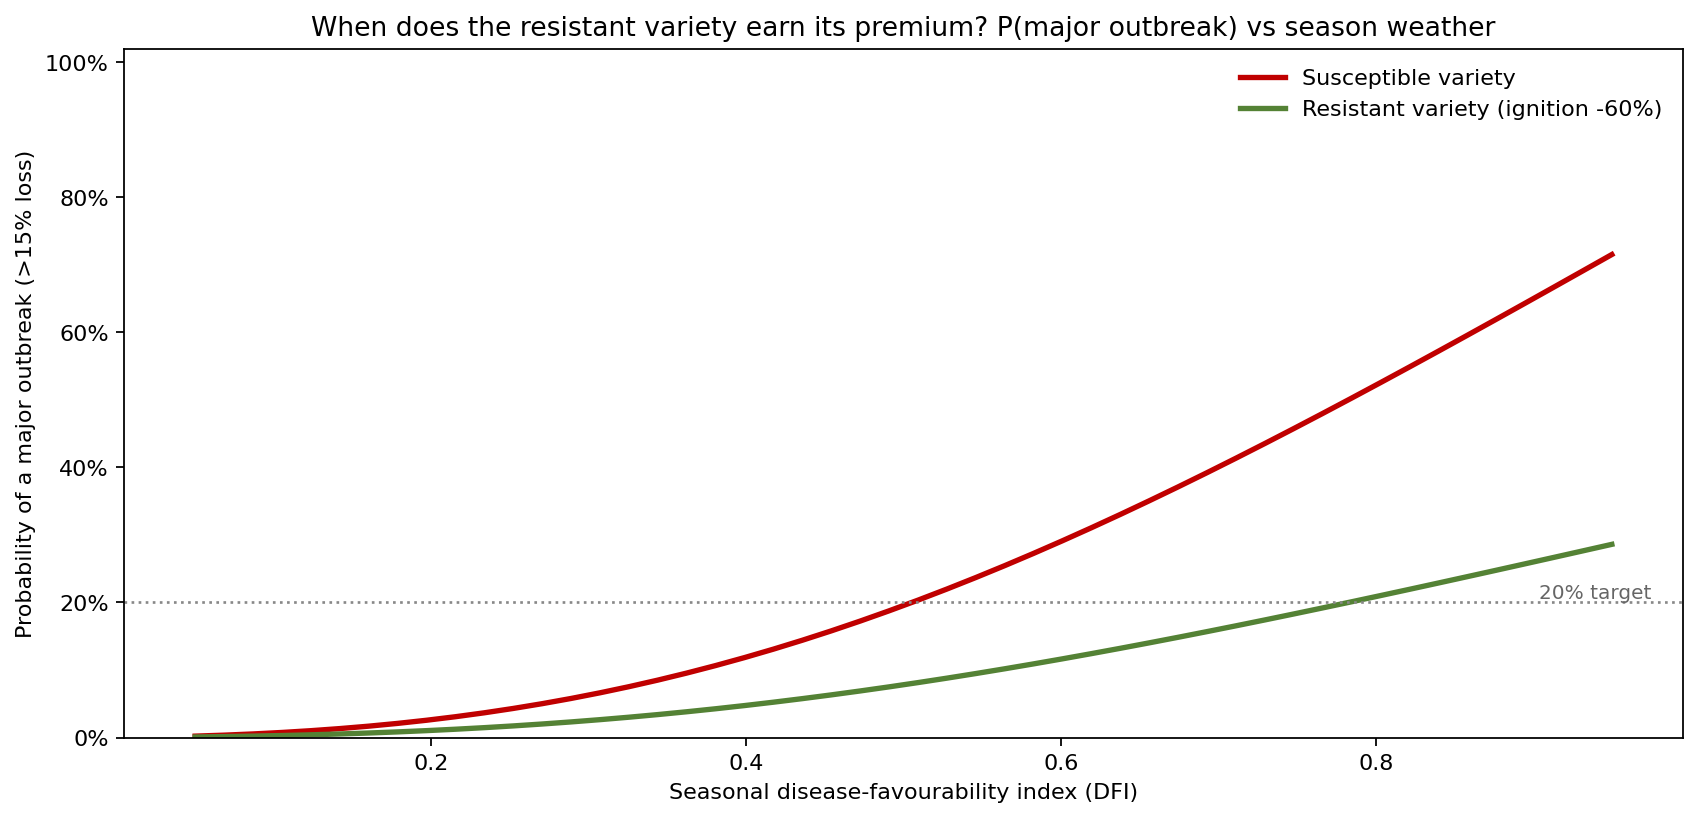
At a favourable DFI of 0.7, the susceptible variety faces a 40% chance of a major outbreak; the resistant variety cuts that to 16%. The two curves barely separate in benign seasons and fan apart sharply as conditions favour the pathogen — so the variety is worth its premium precisely in the high-favourability regions and years where the susceptible crop is most exposed. The crossover, not a blanket policy, drives the planting recommendation.
What the model changed
- Risk reframed from a GBP 2.7M mean to a GBP 28.3M P99, giving the board a number it could actually capitalise against.
- Resistant variety adopted in high-favourability regions, pulling the P90 loss from GBP 12.5M to GBP 1.1M for a GBP 1.1M seed premium.
- Fungicide justified on tail reduction, not mean — accepting a higher expected cost to cut the P99 from GBP 28.3M to GBP 21.0M.
- Outbreak probability and severity linked to a shared weather index, restoring the heavy epidemic tail a constant-probability model had erased.
ModelRisk Functionality Used
- Frequency-severity Monte Carlo simulation of 60,000 seasons, separating outbreak ignition (Bernoulli) from spread severity (Beta).
- Logistic disease-favourability index driving both ignition probability and severity from shared seasonal warmth and humidity.
- Scenario comparison on full distributions (loss-plus-cost CDFs) exposing that mitigation value sits in the P90/P99 tail, not the mean.
- Expected-loss tornado analysis robust to the zero-heavy distribution, ranking severity, favourability, humidity and warmth.
- Threshold-sweep analysis showing P(major outbreak) versus season favourability for susceptible and resistant varieties — the planting decision curve.
A disease loss is not an expected value, it is a thin spike and a fat tail. ModelRisk is what lets a producer buy protection sized to the tail that ruins the year, not to the average that never happens.