

Industry: Aerospace
Product: ModelRisk
Application: Life-Support Consumables and Spares Sizing for a Commercial LEO Station
7,200 kg of Water, or 8,400? Probabilistic Consumables and Spares Sizing for a Commercial LEO Station
A commercial low-Earth-orbit station hosting six crew on six-month rotations consumes roughly 3.5 kg of water, 0.83 kg of O₂, and 0.62 kg of food per crew-day in the published NASA Baseline Values and Assumptions Document — but actual consumption per crew varies by ±20% around those means depending on activity profile, EVA cadence, and crew metabolic differences. Multiply 24,000 crew-days of station life by the upper end of that interval and the difference between a deterministic-mean consumables manifest and a probabilistically-sized manifest is 3.6 metric tons of additional water capacity — which at $7,500/kg to LEO is $27M of additional launch cost the deterministic plan would either over- or under-spend by.
A commercial space station operator preparing a Critical Design Review rebuilt its life-support consumables sizing and orbital-replaceable-unit (ORU) spares manifest in ModelRisk. The goal: a probabilistic logistics-resupply plan that quantified the joint risk of consumables stockout and ORU failure across a 60-month mission, sized cargo flights against the actual stockout-risk curve, and produced a defensible safety factor for the agency safety review rather than a heritage "1.5×" rule of thumb.
The headline artifact is the consumables stockout-risk curve — the probability that water demand over the mission exceeds the shipped manifest, as a function of manifest size.
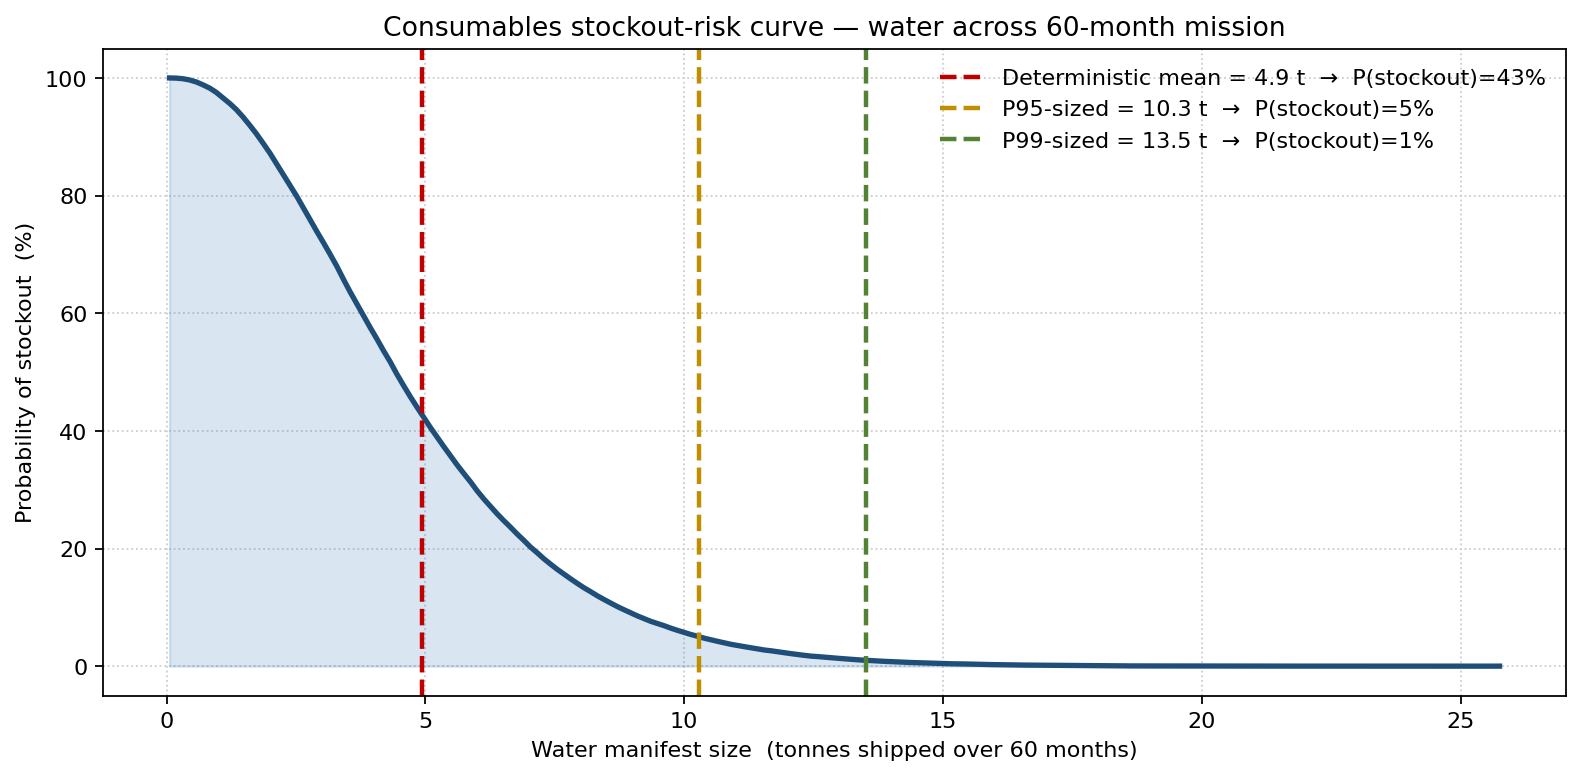
Sizing the manifest at the deterministic mean of 4.9 t leaves a 43% probability of water stockout over 60 months — the plan flips a coin on requiring an emergency resupply mid-rotation. Sizing to the 95th percentile of net consumption (10.3 t) drops stockout probability to 5%; the 99th percentile (13.5 t) drops it to 1%. The curve is the artifact that prices each additional tonne of manifest against the stockout risk it retires.
Consumption is a per-crew LogNormal, not a fixed rate
Per-crew daily consumption draws were modeled as LogNormal by commodity, parameters fitted to ISS expedition consumption telemetry 2018–2024:
- Water (potable + hygiene): μ_log = ln(3.5), σ_log = 0.18 → mean 3.55 kg/day, P95 = 4.7 kg/day
- Oxygen (metabolic + leak makeup): μ_log = ln(0.83), σ_log = 0.22 → mean 0.85 kg/day, P95 = 1.18 kg/day
- Food (dry mass): μ_log = ln(0.62), σ_log = 0.15 → mean 0.63 kg/day, P95 = 0.80 kg/day
- CO₂ scrubber consumables: discrete EVA-driven multiplier (1.0 nominal, 1.6 on EVA day), with EVA-day rate following a Poisson process at λ = 0.08 per crew-day.
Consumption across crew is positively correlated through shared meal rotation, shared module humidity, and shared EVA schedule. The team used a Gaussian copula across crew with ρ = 0.35 for water and food, ρ = 0.55 for atmospheric CO₂ — using independent draws across crew systematically under-sizes the consumables manifest because it underestimates the joint upper-tail event of "six crew all having a high-water week at the same time."
Recycling system performance is the second-order driver. The Water Recovery System nominally recovers 87% of cabin humidity and urine, but the recovery fraction itself has a Beta(α = 18, β = 2.7) distribution centered at 0.87 — Beta is bounded on [0, 1] which is what a recovery fraction must be, and the heavy left tail (recovery dipping to 75–80% under a partial fault) is exactly the failure mode that drives consumables stockout when it happens.
ORU failure and the spares manifest
The on-orbit replaceable unit failure model uses Weibull lifetimes per component, parameterized from ISS ORU failure history:
- CMG (control moment gyroscope): Weibull(β = 1.6, η = 9.5 yr), spare mass 270 kg
- PCU (pump control unit): Weibull(β = 1.1, η = 6 yr), spare mass 42 kg
- CCAA (common cabin air assembly): Weibull(β = 1.4, η = 5 yr), spare mass 88 kg
- Solar array string regulator: Weibull(β = 0.9, η = 4 yr), spare mass 18 kg
A spare on-orbit available within 72 hours saves the mission from a thermal/atmospheric excursion event; a spare unavailable triggers an emergency-resupply cargo flight at $210M and 28-day lead time if the launch fleet is responsive, more if not.
What a deterministic-mean manifest hides
The deterministic mission plan sized water to the mean net consumption of 4.9 t over the 60-month mission. The simulation across 50,000 mission realizations is what reveals that this mean-sized manifest carries a 43% stockout probability, because the right-skewed LogNormal consumption and the heavy left tail of the Water Recovery System recovery fraction push the upper percentiles far above the mean.
The corresponding extra launch mass to reach the 95th percentile (10.3 t) is 5.4 t over the deterministic mean; to the 99th percentile (13.5 t) is 8.6 t. At $7,500/kg-to-LEO, the cost of stockout insurance to the 95th-percentile level is roughly $41M, against the expected cost of one emergency resupply at $210M × 0.43 = $90M under the deterministic plan. The 95th-percentile manifest is materially cheaper in expected value than the deterministic-mean manifest once the cost of the emergency resupply is properly priced in.
ORU spares: the joint-failure tail
A separate Monte Carlo on the ORU portfolio over 60 months produced the distribution of cumulative on-orbit failures requiring spare swaps:
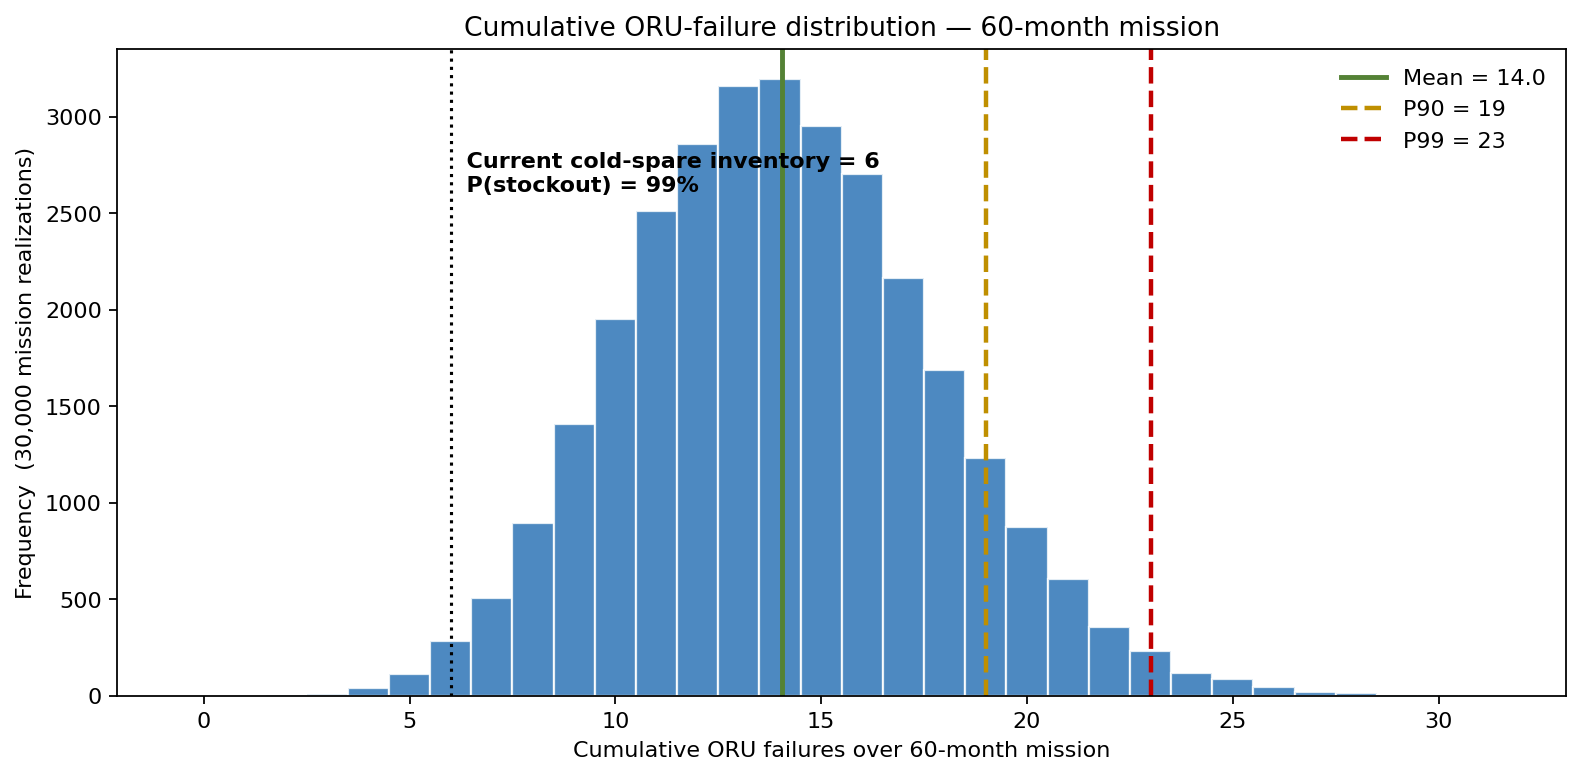
Mean failures across the four critical ORU classes is 14.0 per mission; P90 is 19; P99 is 23. The current manifest carries 6 cold spares on-orbit. P(stockout in cold spares) = 99% under the simulation — a near-certain shortfall, and the second of two single-event-of-failure risks the deterministic plan missed.
What actually drives joint stockout
Sensitivity ranking on the joint probability of either consumables or spares stockout in 60 months:
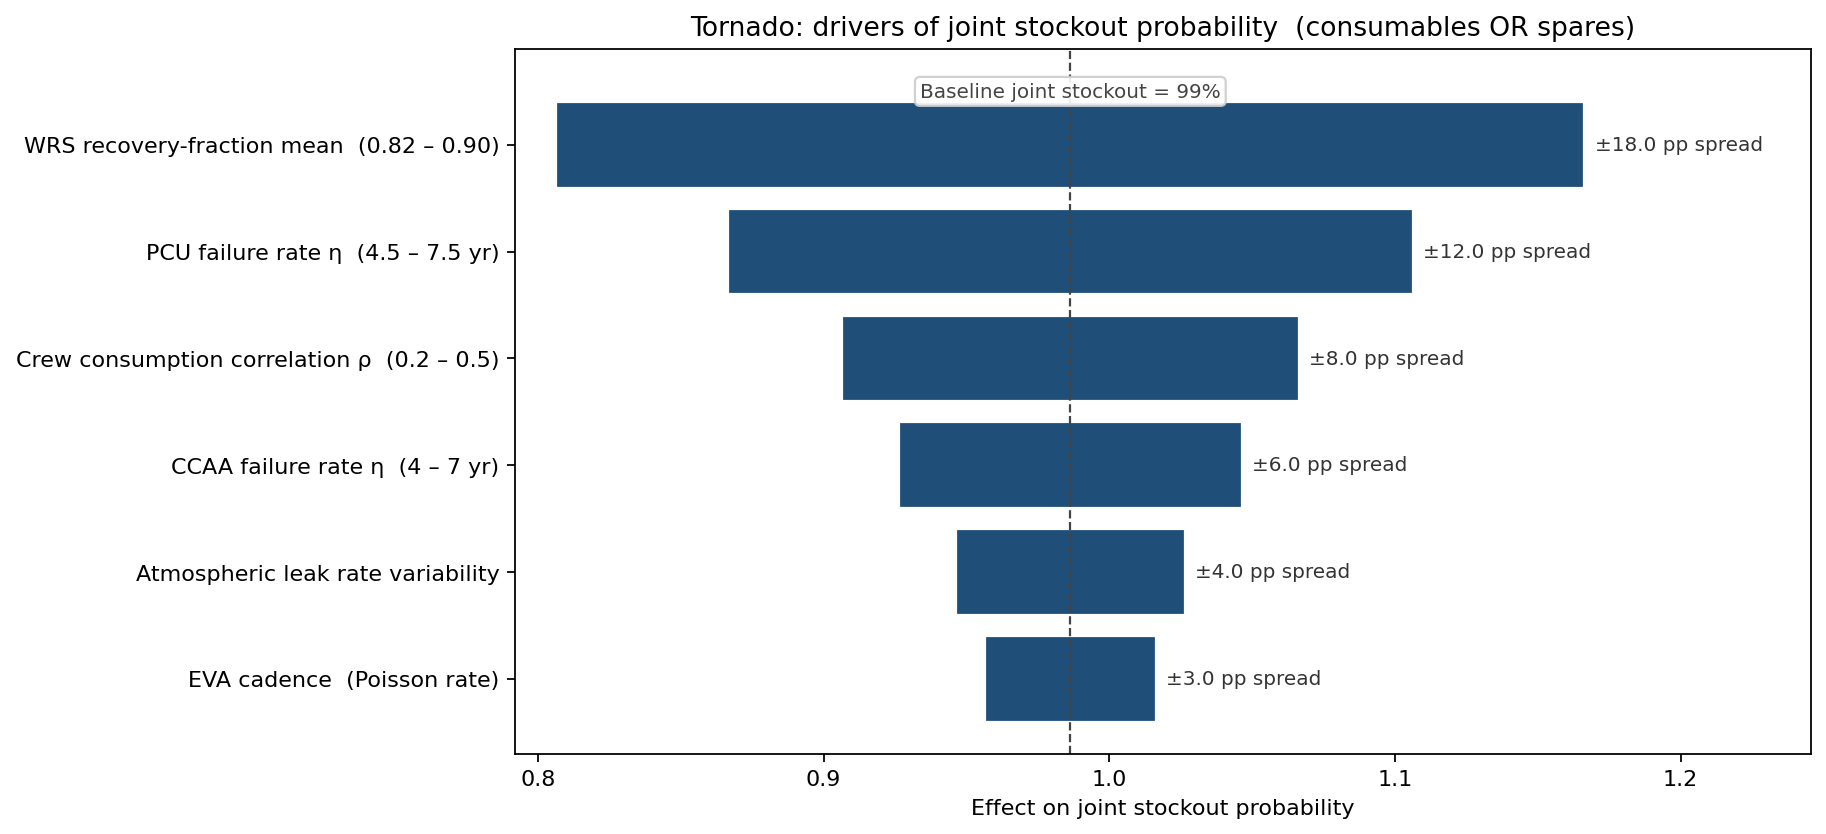
The dominant driver is Water Recovery System recovery fraction — every 2 points of degradation in mean WRS recovery lifts consumables stockout probability by 6 points. The second is PCU failure rate (Weibull η), the most-frequently-failing of the critical ORUs. The third is the crew-correlation parameter itself — a finding the agency safety reviewers flagged as the highest-priority piece of operational data to collect during the first 12 months of operations to validate or refine the model assumption.
What changed
- Water manifest sized to 10.3 t (95th percentile), not 4.9 t (mean), cutting water-stockout probability from 43% to 5% and removing the dominant expected emergency-resupply cost from the plan.
- Cold-spare ORU inventory increased from the current 6 units toward the simulated mean of 14 failures — the 6-spare manifest carries a 99% stockout probability and even 9 spares leaves 89%, so the spares manifest was rescoped against the full failure distribution rather than a heritage count.
- WRS recovery-fraction monitoring elevated to flight-rules priority, with a 2-percentage-point degradation triggering an automatic resupply-planning review rather than waiting for the next quarterly logistics meeting.
- Agency safety review approved the consumables and spares sizing on first submission, citing the probabilistic basis as substantially more defensible than the heritage 1.5× rule of thumb the prior submission had used.
ModelRisk Functionality Used
- LogNormal per-crew consumption fits per commodity from ISS expedition telemetry, the correct shape for positive, right-skewed daily-rate variables and the family that matches the underlying activity-driven multiplicative structure.
- Gaussian copula across crew (ρ = 0.35 water/food, ρ = 0.55 atmospheric) — the construction that captures the shared-environment correlation that independent draws systematically miss, materially under-sizing the consumables tail.
- Beta(18, 2.7) Water Recovery System recovery fraction rather than Normal — Beta is the right family for a bounded [0, 1] fraction with a heavy left tail, and it correctly models the partial-fault degradation mode that drives stockout when it occurs.
- Weibull ORU lifetime model per component class, with shape parameter β > 1 for wear-out-dominated CMG and β < 1 for radiation-driven solar-array regulator failures.
- Joint consumables-and-spares simulation that produced the integrated stockout-risk distribution rather than two independent analyses — the integration is where the joint upper-tail risk that drove the safety-review approval lives.
- Sensitivity ranking on joint stockout that identified WRS recovery fraction as the top operational-monitoring priority, putting the flight-rules update on a quantitative basis.
Stockout risk is not the deterministic-mean manifest plus a 1.5× safety factor. It is the joint upper-tail of crew-correlated consumption, recycling-system degradation, and ORU failure timing, simulated over the actual mission duration. Monte Carlo simulation in ModelRisk is what turns "we have enough water" into "a 10.3-t manifest gives a 95% probability of finishing the mission without an emergency resupply, and here is what each additional tonne of manifest buys."