

Industry: Aerospace
Product: ModelRisk
Application: Launch-Window Optimization Under Weather and Range Risk
The 18-launch manifest is a coin-flip: 53% on a good weather year, a shortfall once the bad-weather season clusters its scrubs
A heavy-lift launch vehicle on the pad burns roughly $230K per hour of hold in standing-army cost, integrated-stack thermal management, and range-asset retainer fees. Every aborted attempt rolls a 24- to 72-hour recycle clock that itself eats budget and customer schedule. For a NewSpace operator running an advertised manifest of 18 launches per year on a 60-minute launch-window policy, the difference between a good convective season and a bad one is the difference between clearing the manifest and missing it — and the operator cannot tell, from a deterministic plan, which kind of year it is buying.
A commercial launch services provider modeled its full annual manifest in ModelRisk against the joint distribution of weather red, range-asset availability red (a separate USAF assignment carrying its own conflict probability with the operator's window), vehicle technical red, and customer-payload red. The model produced a probability distribution for the year's completed-launch count, the cumulative budget impact of holds and scrubs, and a recommendation for the optimal window length per mission class.
The headline result is not "the manifest fails" — it is "the manifest is a coin-flip." Whether the operator clears 18 launches depends almost entirely on a factor it does not control: how bad the convective season turns out to be.
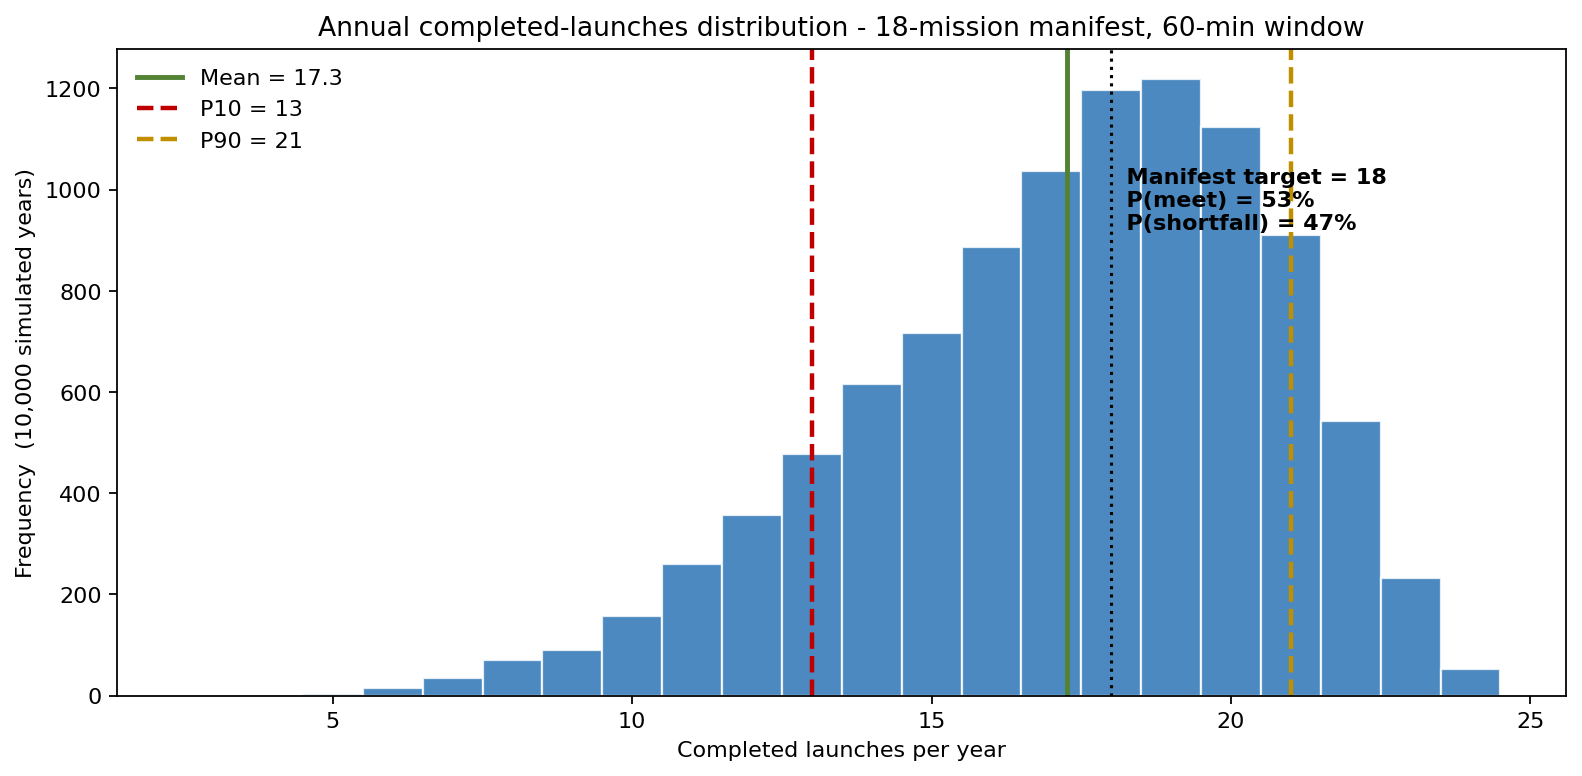
At the current 60-minute window, mean completed launches per year is 17.3, with a P10 of 13, a P50 of 18, and a P90 of 21. The probability of meeting or beating the 18-launch manifest is 53% — and the probability of falling short is 47%. The mean number of attempted launches is 49 (the manifest's 18 missions each retried up to three times), every scrubbed attempt carrying its $230K-per-hour hold cost. On a benign weather year the manifest clears comfortably; on a year when the bad-weather season clusters its scrubs, the shortfall tail reaches down to 13 completions — five launches and tens of millions of dollars short of plan.
Four independent reds, one conditional launch
Each launch attempt requires four independent conditions to be green within the published window:
Weather red at the launch site has a non-stationary base rate by month — March on Florida's space coast is roughly 30% red probability per attempt, August is 65% (afternoon convective activity). Within a given attempt window, the probability of at least one clean 30-minute interval is the conditional weather model, and the team fitted this as a two-state Markov chain on 30-minute weather observations rather than treating each window-attempt as independent (which materially over-counts opportunities). Steady-state red fraction by month was calibrated to 45 CCSFS LCC records spanning 2010–2024.
The shared bad-weather-year factor is the modeling decision that turns this from a degenerate near-constant into a real coin-flip. If every attempt's weather were drawn independently, the 49 attempts in a year would average out and the completion count would barely move year to year — the law-of-large-numbers artifact that hides the actual risk. But weather seasons are correlated: a strong El Niño convective summer, or a year of persistent stalled fronts, degrades every launch attempt's odds at once. The team modeled this as a shared seasonal factor drawn once per year from a LogNormal(0, 0.45) (median 1.0) that scales every month's red rate together. Bad-weather years cluster their scrubs, and that clustering is exactly what produces the 47% shortfall probability and the down-to-13-launch tail — a tail no independent-attempt model can generate.
Range red — the eastern range has 12 commercial-operator slots per month, with USAF mission assignments having priority. Conflict probability with the operator's published window was modeled as Bernoulli(0.12) per attempt, with conflicts conditionally drawing a delay distribution that is LogNormal on hours, μ_log = ln 26, σ_log = 0.5.
Vehicle red — pre-launch technical hold probability was modeled as a thinned Poisson process at λ = 0.10 holds/hour across the T-6h to T-0 timeline, with each hold conditionally requiring a LogNormal recovery time. The pretty-standard mistake of multiplying "average attempt success" by "probability of hold" was avoided by counting holds, then sampling per-hold severity — the correct construction for a counting process.
Customer red — payload-side hold probability (customer-initiated recycle for spacecraft-bus issues) was modeled as Bernoulli per attempt at a rate of 0.06, fitted to the operator's mature-spacecraft-bus history.
A launch attempt succeeds only if all four are green within the window — and the year's completion count is not a sum of independent coin flips, because the shared seasonal weather factor couples every attempt in the manifest through one common cause.
What a deterministic 18-launch manifest hides
The deterministic plan counted 18 launches/year on an average-weather assumption and a single attempt each. The distribution above tells a different story: completions are not a fixed 18 but a distribution centered at 17.3 with a P10 of 13 and a P90 of 21, and the manifest is cleared in only 53% of simulated years. The deterministic average-year plan cannot represent the one variable that decides the outcome — whether the convective season is benign or brutal — because that variable lives entirely in the year-to-year spread, not in the mean. The mean attempted-launch count of 49 against 17.3 completions is the scrub overhead the single-point plan never priced.
What the window length actually buys
The team swept candidate window-length policies, from instantaneous (0 min, no slip-of-T-0 tolerance) through a 4-hour smart window:
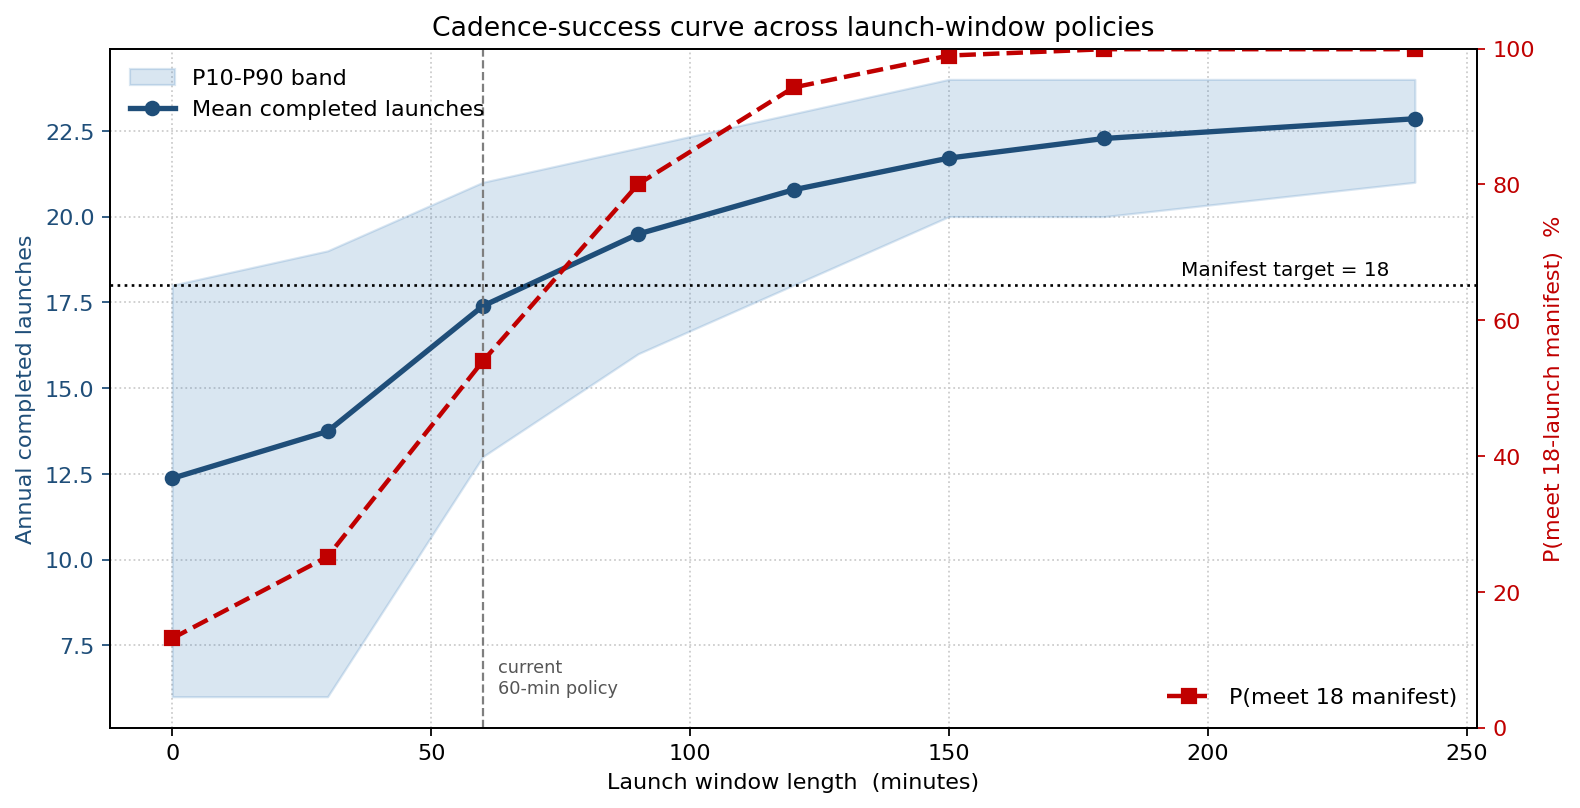
The shape of the curve is what matters — and it is steepest right where the operator sits today. At the current 60-minute window, mean completions are 17.4 and the manifest is met 54% of the time. Extending to a 90-minute window lifts mean completions to 19.5 and P(meet 18) to 80% — a 26-point jump in cadence confidence for one extra half-hour of window. Push to 120 minutes and P(meet) reaches 94% (mean 20.8), but beyond that the curve flattens hard: 150 minutes buys 99% and 240 minutes saturates at the manifest. The breakeven where the marginal mission-day cost of a longer window equals the marginal completed-launch revenue lands at 90 minutes for sun-synchronous polar missions and 120–150 minutes for geostationary transfer missions (the latter has tighter instantaneous-only inclination constraints in some cases).
What actually drives cadence
Sensitivity ranking on mean annual completed launches:
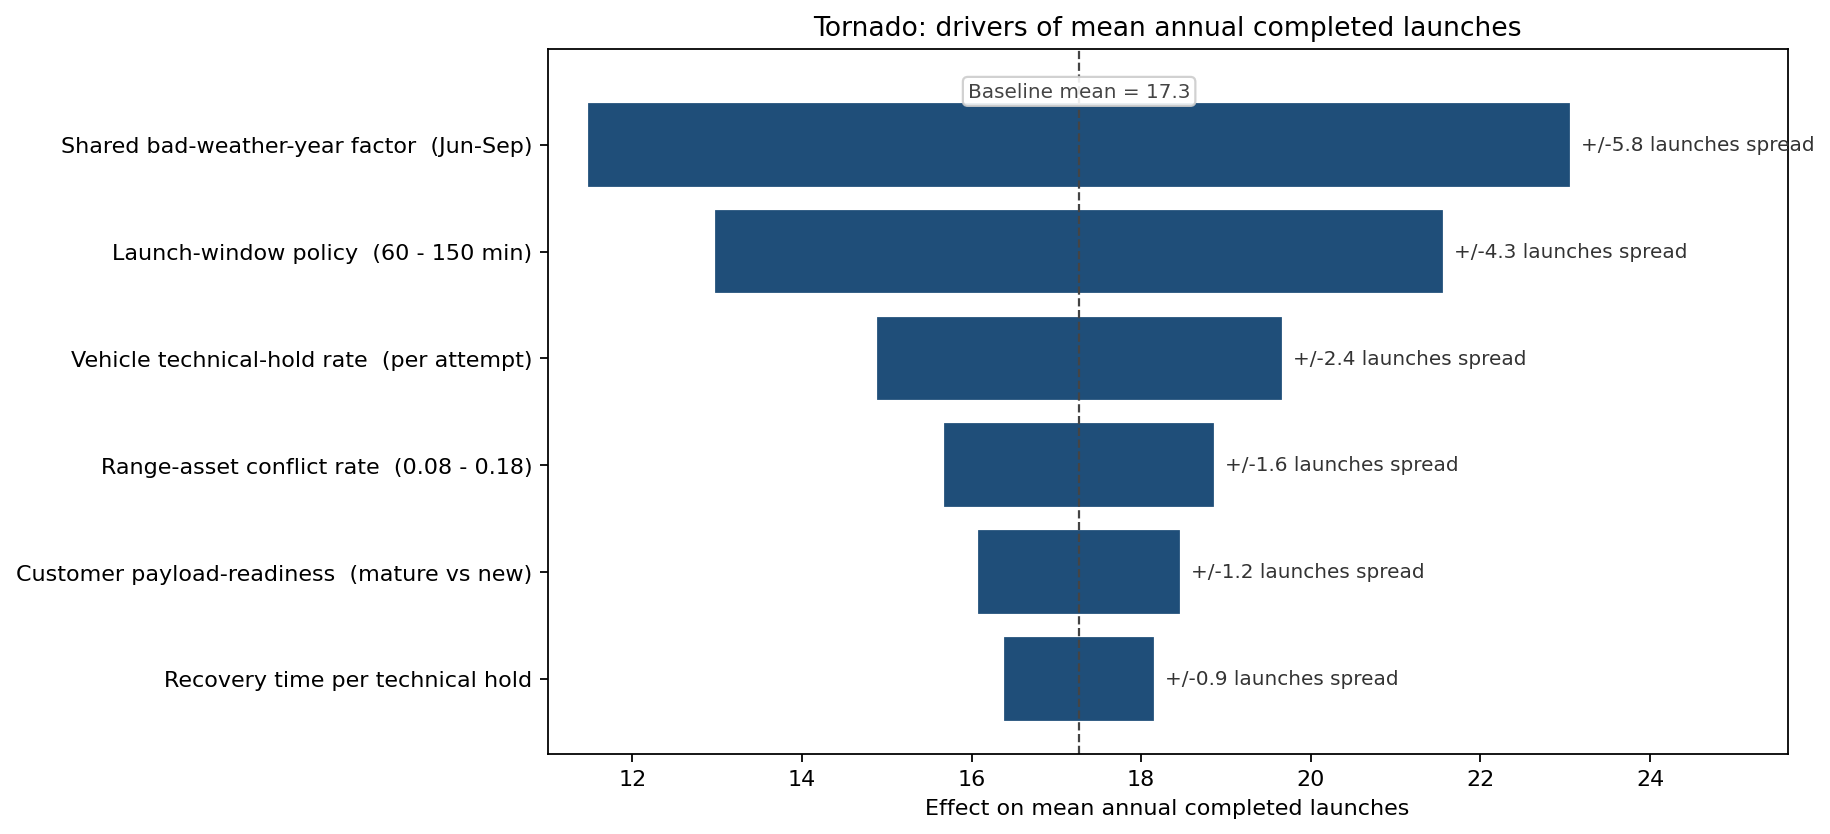
The dominant driver is the shared bad-weather-year factor — the year-level convective-season severity that scales every June–September attempt together, worth 5.8 launches of swing, and precisely the variable a deterministic average-year plan cannot represent. The second is the launch-window policy itself (4.3 launches), the operator's most direct lever. The third is vehicle technical-hold rate per attempt, controllable by additional pad-side troubleshooting investment and pretty directly purchasable.
What changed
- Window length extended from 60 to 90 minutes for sun-synchronous missions (and 120–150 minutes for GTO) at the manifest planning meeting, lifting P(meet the 18-launch manifest) from 54% to 80% and mean completions from 17.4 to 19.5 — the steep early part of the cadence-success curve where each added half-hour buys the most cadence confidence.
- Two payloads moved out of August-September into shoulder-season slots where the weather-red rate drops by 25 percentage points, reducing their exposure to the bad-weather-year clustering that drives the shortfall tail.
- $1.2M/year pad-troubleshooting investment approved based on the tornado ranking that put vehicle technical-hold rate among the top drivers of cadence the operator can directly buy down — the payback comes in 9 months on the marginal-completed-launch revenue.
- A communicable cadence story for customers. Instead of an unconditional "18 launches in 2026," the commercial team can now offer customers a P50 launch date and a P90 contractual backstop date that the simulation directly produces, putting launch-services contracts on the same probabilistic basis customers use for their own program schedules.
ModelRisk Functionality Used
- Shared seasonal weather common factor — a single LogNormal(0, 0.45) severity multiplier drawn once per year and applied to every month's weather-red rate, the construction that makes scrubs cluster and turns the completion count from a law-of-large-numbers near-constant into a real coin-flip (P(meet 18) = 53%, shortfall tail to 13 launches).
- Two-state Markov chain on weather observations rather than independent per-attempt sampling — the correct construction for a serially autocorrelated weather state, and the one that materially changes the answer at long window lengths.
- Poisson + LogNormal compound for pre-launch technical holds, counting holds first and then drawing recovery time per hold — the construction that avoids the rate-vs-probability error common in shorthand launch-readiness models.
- Bernoulli range-conflict model with conditional LogNormal delay on conflict, calibrated to USAF eastern-range allocation history.
- Window-length policy sweep producing P(meet the manifest) at each window length — the curve that showed 60→90 minutes lifts cadence confidence from 54% to 80% and informed the per-mission-class window decision.
- Sensitivity ranking on annual cadence that put the shared bad-weather-year factor (5.8 launches) and window-length policy (4.3 launches) as the top two drivers — and put the pad-troubleshooting investment on a quantitative payback basis.
Cadence is not the published manifest. It is a joint distribution of weather, range, vehicle, and customer readiness, coupled through one shared bad-weather-year factor, integrated over a window of operator-chosen length and priced against a $230K-per-hour standing army. Monte Carlo simulation in ModelRisk is what turns "we're targeting 18 launches" into "the current 60-minute policy clears 18 just 53% of the time, a 90-minute window lifts that to 80%, and here is what each additional half-hour of window costs and buys."