

Industry: Aerospace
Product: ModelRisk
Application: Mission NPV and Go/No-Go Risk for Deep-Space Exploration
$4.1 Billion at P50, $6.0 Billion at P90: Phase-Gated NPV for a Mars Sample-Return Mission
A flagship-class deep-space exploration mission — a Mars sample-return campaign in the NASA/ESA mold — runs five phases over 11 years from instrument selection through Earth return, with each phase carrying a real probability of cost overrun, schedule slip, and mission failure. The published baseline cost at SRR is $4.2 billion. The published baseline schedule shows a December 2034 sample-return entry. Decades of NASA program-cost history (Hertzfeld, Bitten, et al. on the IPAO database) report a roughly 40% mean cost growth from preliminary design to launch on missions of this class. Yet selection committees still see point estimates.
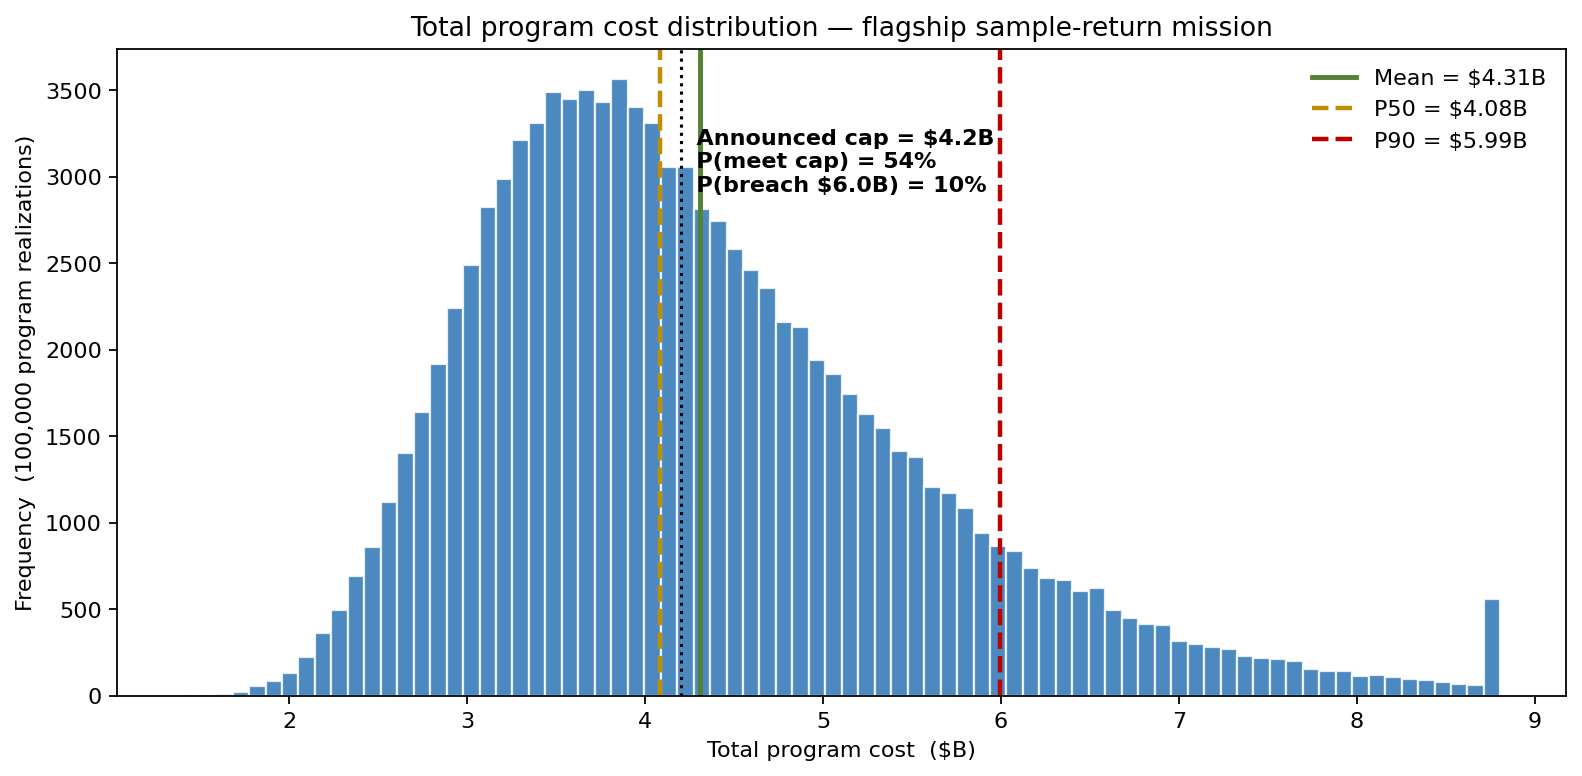
A space-agency program office working on a Mars sample-return concept built a phase-gated probabilistic NPV model in ModelRisk to give the agency administrator and the OMB analyst a single defensible answer to two questions: what is the probability the mission completes within the announced cost cap, and what is the cost of insuring against the failure modes that drive most of the tail? The simulation's answer is the distribution below: across 100,000 program realizations the mean total cost lands at $4.31B with a P90 of $5.99B, and the announced $4.2B cap is met only 54% of the time.
Five phases, five failure modes, one cascading model
The mission is decomposed into five gated phases, each with its own cost distribution, schedule distribution, and conditional probability of advancing to the next phase. Correlation across phases is explicit — the same project culture and prime contractor that overruns in formulation tends to overrun in fabrication, and the model captures this with a Gaussian copula across phase cost-overrun residuals (ρ ≈ 0.45 within prime, ρ ≈ 0.15 across primes).
| Phase | Baseline cost ($B) | Cost distribution | Schedule mean (months) | P(advance) |
|---|---|---|---|---|
| Formulation (Phase A/B) | 0.55 | LogNormal, σ_log = 0.32 | 34 | 0.96 |
| Design (Phase C) | 0.95 | LogNormal, σ_log = 0.30 | 28 | 0.93 |
| Fabrication / I&T (Phase D) | 1.65 | LogNormal, σ_log = 0.38 | 36 | 0.91 |
| Launch & cruise | 0.70 | LogNormal, σ_log = 0.20 | 9 | 0.95 launch × 0.94 cruise |
| Mars ops + sample return | 0.35 | LogNormal, σ_log = 0.45 | 42 | 0.88 |
The conditional P(advance) values multiply to a baseline end-to-end mission success probability of 0.64 — already substantially below the 0.95 single-launch figure that often gets quoted, because it correctly accounts for the multiple non-launch failure modes (instrument anomaly during cruise, sample-collection failure, Earth-return capsule loss) that historical Mars mission outcomes show are at least as likely as a launch loss for sample-return architectures.
Schedule risk drives cost risk through standing-army carrying costs: every additional month in Phase D costs $42M in burn rate. Schedule distributions per phase were modeled as LogNormal on duration (positive, right-skewed, the standard shape for IPAO-fitted phase durations), with the conditional Phase D duration depending on the Phase C outcome via a copula.
What the deterministic NPV hides
The deterministic program plan reports an NPV of −$3.7B at the agency 7% real discount rate (negative because exploration science benefits are intentionally treated as non-monetary; the relevant policy comparison is cost-to-government). The simulation reports a distribution instead of a point — and the cost-distribution chart at the top of this article is where the SRR submission's single number comes apart. Mean total cost (including failure-mode rework and standing-army carry) is $4.31B, the median (P50) is $4.08B, and P90 is $5.99B. The probability of completing under the announced $4.2B cap is 54% — barely a coin flip. The probability of breaching $6.0B — the level at which the program would face a Nunn-McCurdy-style breach review in DoD parlance, or the equivalent OMB intervention in agency programs — is 10%. None of these were visible in the SRR submission.
What actually drives the tail
Sensitivity on the P90 program cost:
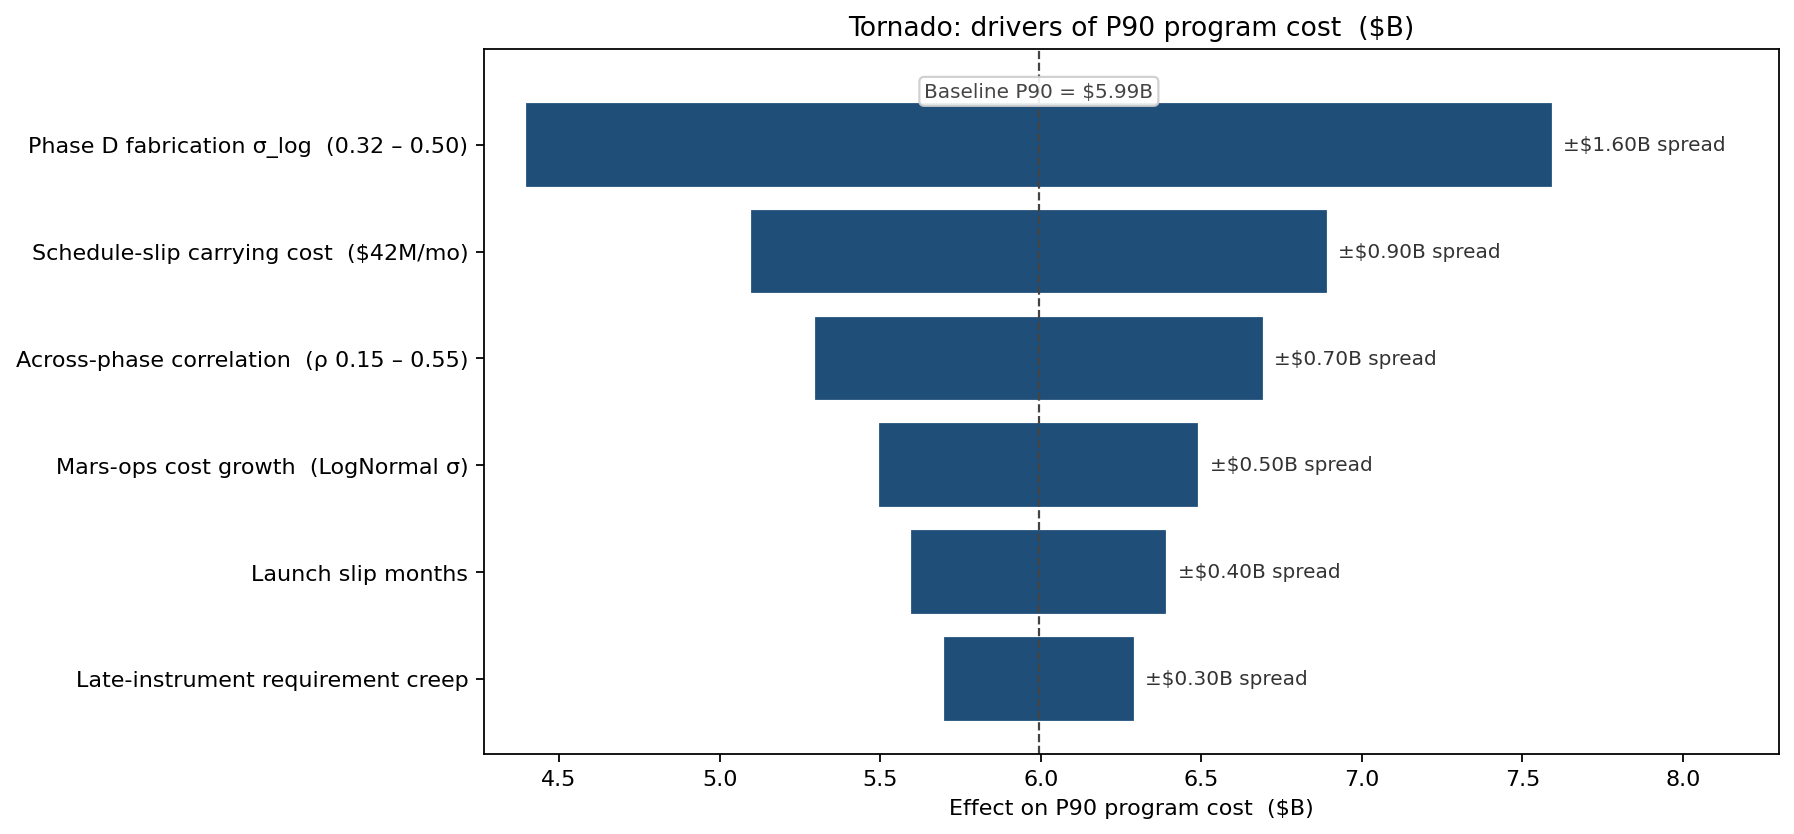
The dominant driver is Phase D fabrication cost-growth (σ_log) — historical IPAO data shows σ_log between 0.32 and 0.50 across flagship missions, and it swings P90 cost by ±$1.60B around the $5.99B baseline, more than the next two drivers combined. The second is schedule-slip carrying cost (standing-army rate × Phase D months over baseline) at ±$0.90B, confirming that the cheapest path to P90-cost reduction is investment in schedule risk reduction in formulation. The third is the across-phase correlation itself at ±$0.70B — if the program manages to break the correlation by aggressive Phase B risk burn-down before Phase D begins, the model shows a P90 reduction of comparable size.
Go / no-go phase gates with explicit reversibility cost
The program office used the model to price three candidate gate decisions at PDR (end of Phase B):
- Go on baseline architecture (single sample-collection lander).
- Go on dual-lander architecture (additional $0.6B in formulation, raises Mars-ops P(success) from 0.88 to 0.96).
- No-go / defer 2 years: restart Phase B in FY27 — cost the 2-year program burn ($0.9B sunk) but reset the Phase D σ_log distribution with the benefit of a new launch-vehicle generation.
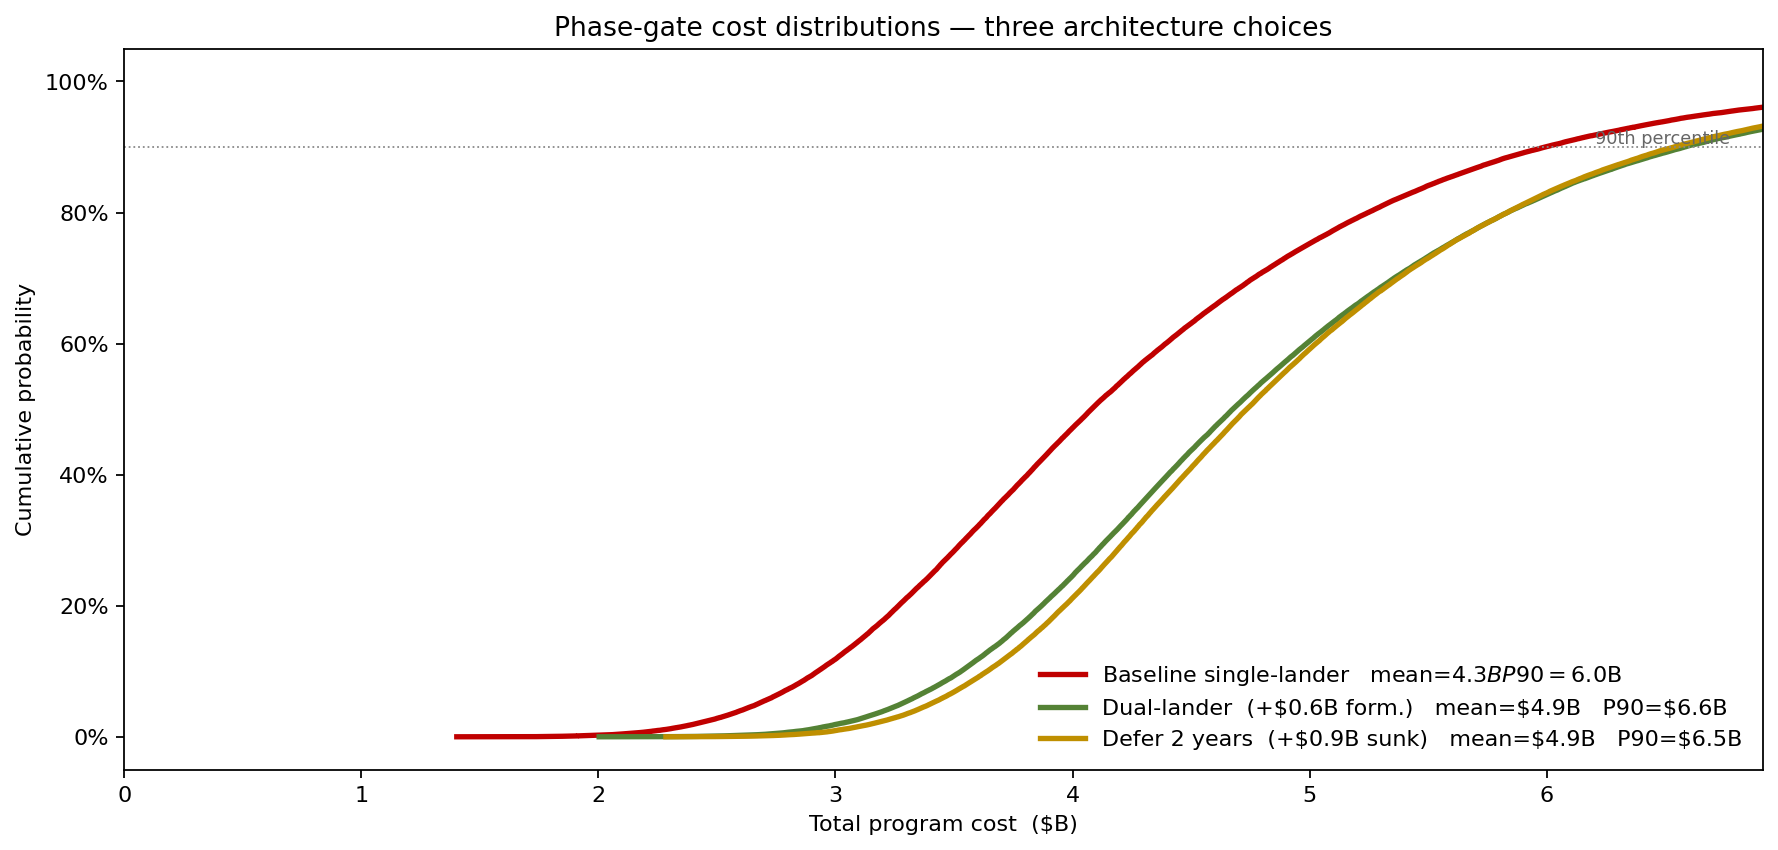
The CDF compares the three options on cost alone, and on that axis the baseline dominates: baseline mean $4.3B / P90 $6.0B, dual-lander $4.9B / P90 $6.6B, defer $4.9B / P90 $6.5B. Adding the second lander shifts the entire cost distribution right by about $0.6B; deferring two years shifts it by about $0.9B in sunk cost. The decision therefore turns on what the cost chart cannot show — the dual lander raises Mars-ops P(success) from 0.88 to 0.96, roughly an 8-point lift in the gate that historically loses sample-return missions. For a flagship that will only fly once, the agency's effective utility function is steeply concave in mission failure, so that ~$0.6B premium is weighed against an 8-point reduction in the chance of returning empty-handed. The deterministic NPV comparison, which is linear in cost and assigns zero value to the increment in success probability, never frames that trade at all.
What changed
- Cost cap re-examined at the OMB pass-back round after the model demonstrated that the announced $4.2B cap had only a 54% probability of being met — barely a coin flip — and that the $6.0B breach-review level sat at the P90 of the cost distribution.
- Dual-lander architecture put forward at PDR against the deterministic NPV recommendation, on the strength of the 8-point improvement in Mars-ops mission-success probability (0.88 → 0.96) weighed against its ~$0.6B mean-cost premium.
- $280M of Phase B risk-burn-down funding approved (instrument breadboarding, cruise-stage thermal qual articles) — directly justified by the sensitivity ranking that showed Phase D σ_log as the largest tail-cost driver.
- A model the next mission inherits. The phase-gated framework is now the agency's default for any flagship-class concept review, with the IPAO σ_log priors and the conditional advance probabilities maintained as institutional knowledge rather than rebuilt per program.
ModelRisk Functionality Used
- Phase-gated LogNormal cost model with σ_log priors per phase calibrated to the IPAO flagship-mission database, the correct distribution family for positive, right-skewed cost variables on multi-year programs.
- Gaussian copula across phase cost residuals that captures the institutional reality that overrun in formulation predicts overrun in fabrication — with ρ ≈ 0.45 within-prime and ρ ≈ 0.15 across-prime parameters fitted to historical NASA cost-account residuals.
- Conditional advance-probability multiplication that produces an end-to-end mission success of 0.64 against a 0.95 single-launch figure, correctly accounting for instrument, cruise, and sample-collection failure modes.
- Standing-army cost coupling that ties schedule slip directly to cost via a fixed burn-rate, so schedule and cost distributions are jointly generated rather than independently sampled.
- Architecture-scenario CDF comparison at three decision points (baseline, dual-lander, defer) that produced the mission-success-vs-cost-cap trade-off used to support the PDR decision.
- Sensitivity ranking on P90 cost that identified Phase D σ_log, schedule-slip carrying cost, and across-phase correlation as the three highest-leverage drivers — and put the $280M risk-burn-down allocation on a quantitative basis.
A flagship mission's cost is not its baseline. It is a phase-correlated, copula-linked, schedule-coupled distribution whose tail is what the OMB pass-back actually punishes. Monte Carlo simulation in ModelRisk turns the question "is the cost cap right?" into the only question that matters: what is the probability we meet it, and what does it cost to lift that probability by ten points?