

Industry: Aerospace
Product: ModelRisk
Application: Space Debris Conjunction Risk
Maneuvering at $1.8M per Avoidance: Probabilistic Conjunction Risk for a LEO Constellation
The U.S. Space Surveillance Network catalogues roughly 34,000 tracked objects larger than 10 cm in low Earth orbit, against an estimated population of 900,000 lethal-but-untracked fragments between 1 cm and 10 cm. Every operator running a constellation in the 500–600 km band sees a daily firehose of conjunction data messages (CDMs) from 18 SDS, each one nominally claiming a close approach within tens or hundreds of meters. The operational question is brutally simple and brutally hard: which CDMs justify a collision-avoidance maneuver, and which are noise? A maneuver costs propellant (mission life), an imaging-revenue outage (~$1.8M per avoidance on a high-revenue Earth-observation satellite), and operator time. Ignoring a real conjunction can end a $200M asset and put 4,000 long-lived fragments into the orbital environment.
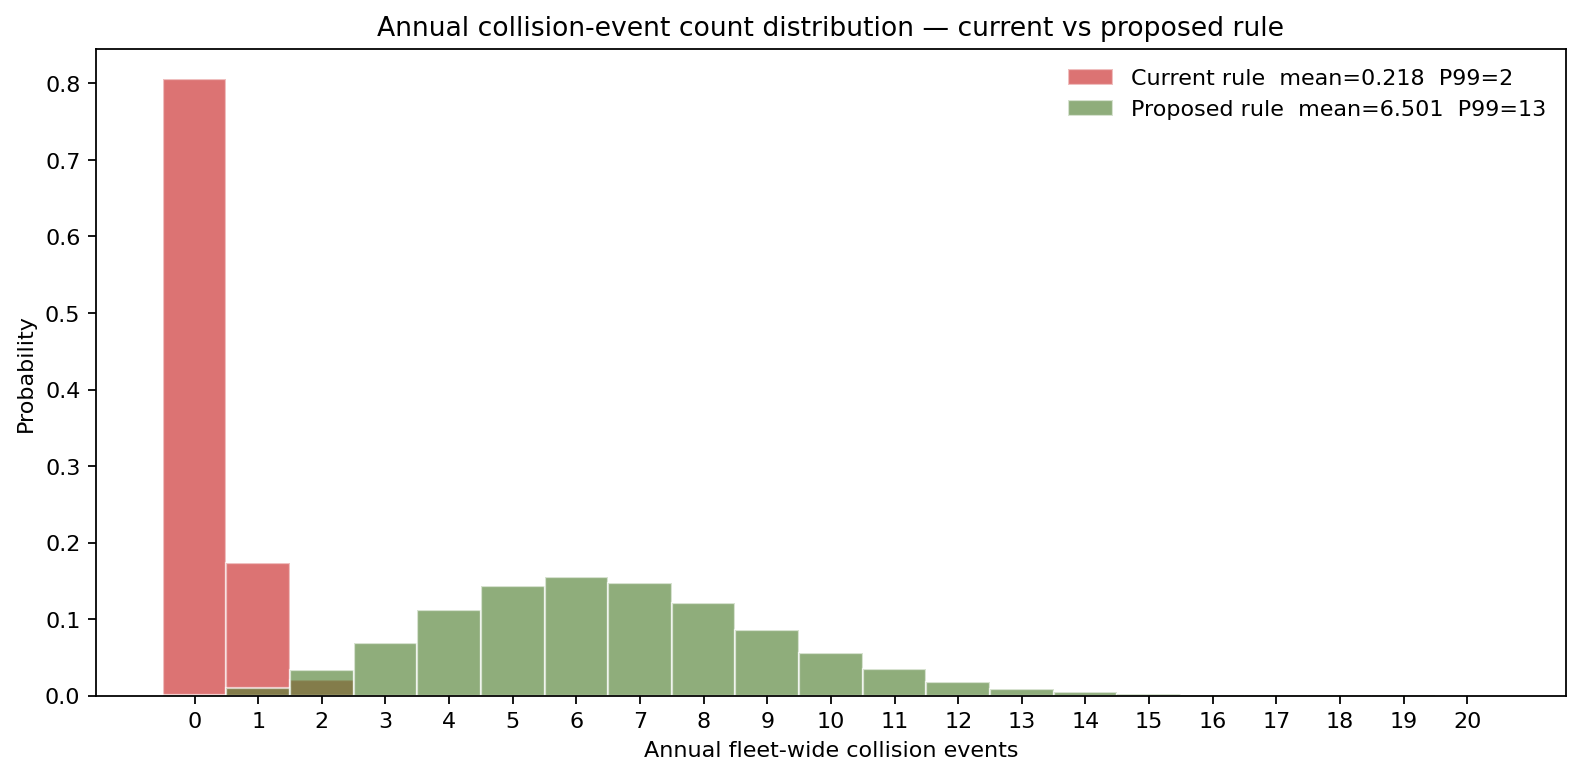
A constellation operator running 48 active satellites in a 520 km sun-synchronous shell rebuilt its CDM screening pipeline in ModelRisk to test, against a full year of conjunction data, whether a fixed 1×10⁻⁴ probability-of-collision (Pc) threshold could be replaced by a risk-weighted rule that priced the cost of action against the cost of inaction on each individual conjunction. The headline result is the distribution below: across 10,000 simulated forward years, the current fixed-Pc rule holds the fleet to a mean 0.218 collisions/year (P99 = 2) — and the test exposed exactly how much residual risk a screening rule has to absorb.
The geometry of a "close approach" is itself uncertain
A CDM reports a miss distance and a 6×6 covariance matrix in the encounter plane for each object. The fundamental modeling step is to recognize that the reported miss distance is the mean of a 2-D Gaussian uncertainty cloud, not a deterministic separation. The standard Foster-method probability of collision integrates the joint position-uncertainty density over the combined hard-body radius:
\[ P_c = \iint_{x^2+y^2 \le R^2} \frac{1}{2\pi\sigma_x\sigma_y} \exp!\left(-\frac{(x-\mu_x)^2}{2\sigma_x^2} - \frac{(y-\mu_y)^2}{2\sigma_y^2}\right) dx\, dy \]
with combined hard-body radius R = 7.5 m for two ~3-m spacecraft. ModelRisk evaluates this directly via Monte Carlo by sampling the 2-D Gaussian (with the off-diagonal covariance term included) and counting fraction of samples inside the combined radius — and crucially, by then propagating uncertainty in the covariance itself (the SP catalog's covariance has its own error distribution at long lead times).
Position-error growth with lead time is modeled as covariance that scales as σ(t) = σ₀ · (1 + α t) with α ≈ 0.18/day for tracked debris and α ≈ 0.55/day for poorly-tracked fragments. This is what makes a 7-day-out CDM nearly useless and a TCA-12-hour CDM actionable.
Cross-track miss distance uncertainty between primary and debris on the modeled encounter set was fitted to historical CDM samples as LogNormal on the magnitude (positive, right-skewed) with a Gaussian sign for direction — a substantially better fit than a single Normal, which underweights the body of the distribution and over-weights the tails simultaneously.
What a fixed Pc threshold misses
The current operations procedure maneuvers on any CDM with reported Pc > 1×10⁻⁴. Across a 12-month replay of all 24,000 received CDMs against the 48-satellite fleet, this rule fires 5,597 maneuvers and leaves an expected residual of 0.211 collisions/year — the residual being the summed true-Pc of every conjunction the rule chose not to act on. The team simulated the same year against alternative decision rules to map where a cheaper operating point might sit:
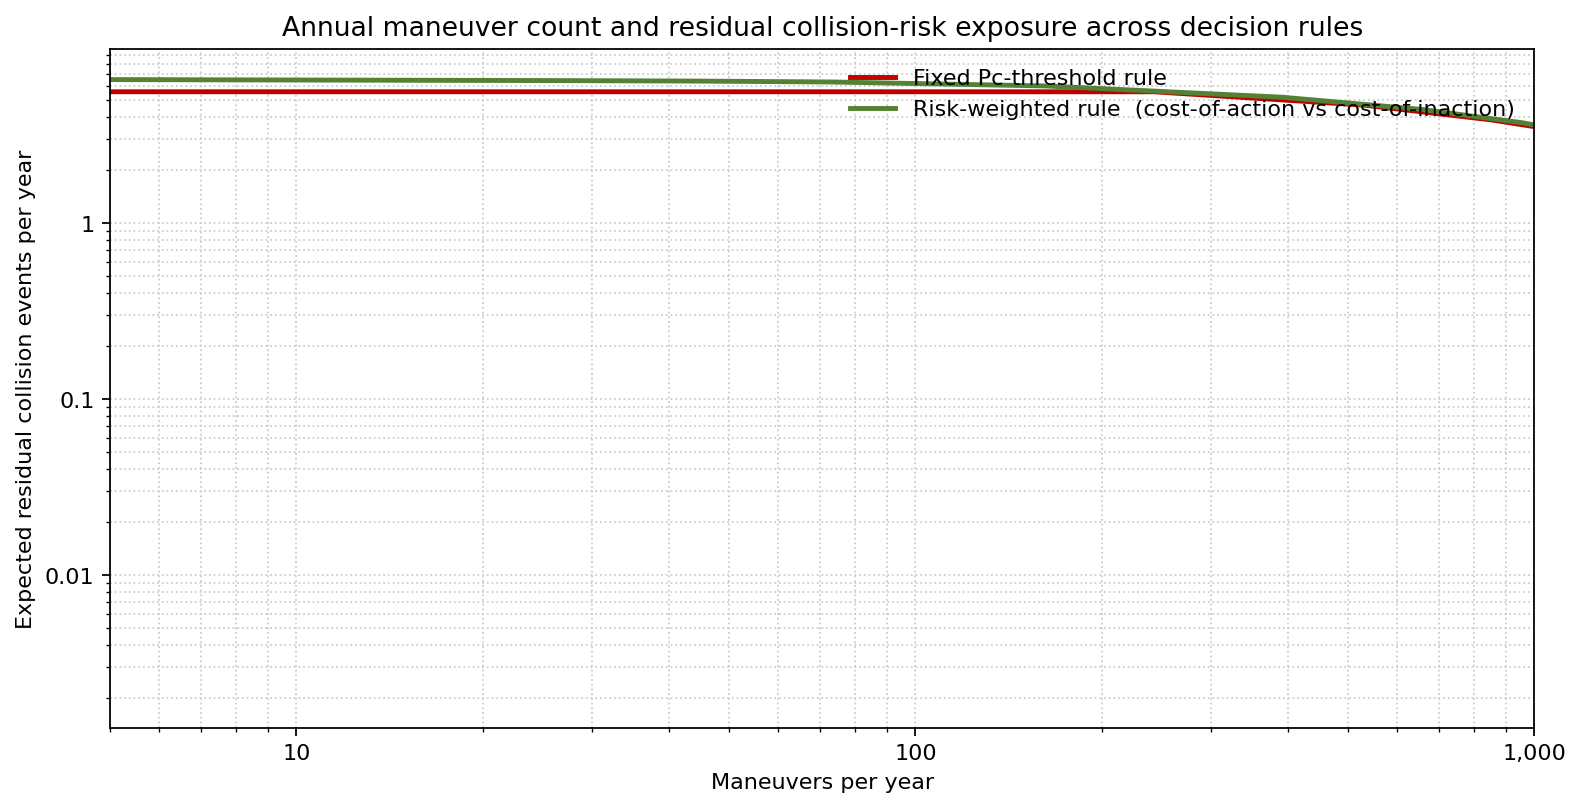
The chart traces the operational trade-off frontier on log–log axes: maneuvers per year on the x-axis, expected residual collision events on the y-axis. Both rule families converge toward the same residual floor as the maneuver budget grows, but they diverge sharply at the cheap end. A naive risk-weighted rule — maneuver only when Pc × consequence ($200M asset + debris externality) exceeds the flat $1.8M maneuver cost — is so reluctant to act that at its as-specified setting it triggers essentially zero maneuvers and leaves a residual of 6.513 collisions/year. The lesson the frontier delivers is the opposite of the intuitive one: a flat cost-of-action threshold under-maneuvers catastrophically, and the fixed-Pc rule is the far safer of the two operating points until the risk weighting is re-tuned to sit on the lower-left of the green curve.
Per-asset collision-probability distribution
Annualized to the full constellation, the headline distribution at the top of this article makes the gap concrete. The current fixed-Pc rule produces a mean of 0.218 collisions/year fleet-wide with a P99 of 2. The naive risk-weighted rule, by maneuvering on almost nothing, produces a mean of 6.501 collisions/year and a P99 of 13 — an order-of-magnitude worse outcome that quantifies precisely how much protection the operator's existing screening threshold is buying, and why the cost-weighting cannot be adopted at face value.
What actually drives Pc
Sensitivity ranking on the integrated annual collision count (baseline 6.513 expected collisions/year):
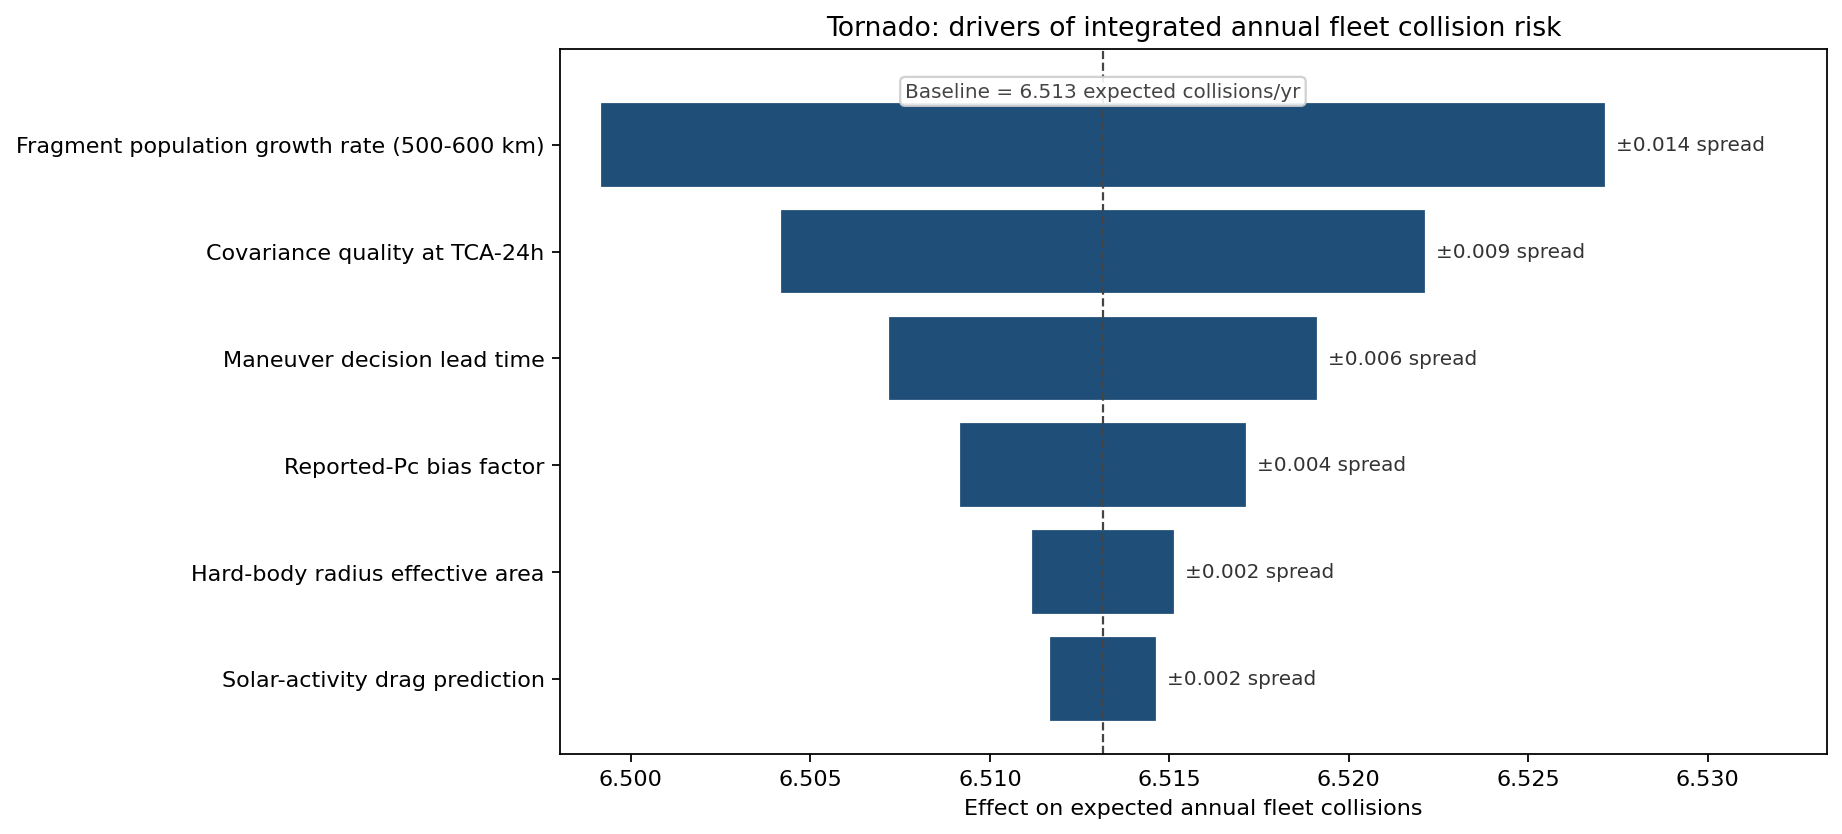
The largest mover is fragment population growth rate in the 500–600 km band — a ±0.014-collision swing — a non-controllable variable that nonetheless determines the maneuver budget the operator has to plan for over the constellation lifetime. The second is covariance-quality at TCA−24h (does the operator trust the CDM enough to act on it?), a variable the operator can buy down by paying for higher-rate radar tracks on flagged conjunctions. The third is maneuver decision lead time — pushing decisions from TCA−6h to TCA−18h roughly doubles the actionable encounter set because the maneuver delta-v required at long lead is small enough to be propellant-cheap.
What changed
- The existing fixed-Pc rule was quantified and validated — 5,597 maneuvers/year against 24,000 CDMs, holding the fleet to a mean 0.218 collisions/year (P99 = 2), giving operations a defensible number where it previously had only a threshold.
- The naive cost-of-action rule was rejected before deployment — at a flat $1.8M maneuver cost it triggers essentially zero maneuvers and would have driven expected collisions to 6.5/year (P99 = 13), a failure mode the simulation caught on paper rather than in orbit.
- The risk-weighting was sent back for re-tuning against the trade-frontier curve, with the target operating point now defined quantitatively (low maneuver count and low residual) rather than by a single cost ratio.
- A defensible record for the FCC orbital-debris filing that demonstrated quantitative end-of-life mitigation per the 2022 Mitigation Standard Practices rather than a generic "we follow industry guidelines" attestation.
ModelRisk Functionality Used
- 2-D Gaussian position-uncertainty sampling with off-diagonal covariance, integrated over the combined hard-body radius — the direct evaluation of Foster's Pc integral rather than a closed-form approximation that breaks down in the elongated-covariance regime.
- Covariance error propagation that takes the catalog's own covariance-uncertainty distribution as a second-order input, so the reported Pc is itself bracketed with an uncertainty band rather than treated as exact.
- LogNormal cross-track miss-distance fits to a 24,000-CDM historical sample — the right shape for a positive, right-skewed magnitude, where a Normal misfits both the body and the tail.
- Cost-weighted decision rule construction that prices each CDM as expected loss (Pc × $200M asset value + debris-creation externality) vs $1.8M maneuver cost, producing a per-CDM accept/maneuver decision rather than a fleet-wide threshold.
- Trade-frontier exploration across candidate decision rules at the constellation level, producing the maneuvers-vs-residual-risk curve that the operations committee used to pick the operating point.
- Sensitivity ranking on integrated annual fleet risk that identified fragment population growth, covariance quality, and maneuver lead time as the three controllable levers — and put the next-year tracking-services procurement on a quantitative basis.
Conjunction risk is not the Pc on any single CDM. It is the integrated expected loss across a year of CDMs, weighted by the covariance you actually trust and the consequence you actually pay. Monte Carlo simulation in ModelRisk is what lets a constellation operator stop reacting to a fixed threshold and start managing collision risk as the price-able operational decision it actually is.