

Industry: Aerospace
Product: ModelRisk
Application: Flight Scheduling
The schedule clears its 82% A14 commitment on an average day — but breaches it on 28% of summer days once delays propagate
A network carrier operating 220 aircraft and 1,400 daily flights ships a summer schedule with a stated DOT on-time-performance commitment of A14 = 82% — arrival within 14 minutes of schedule. The number an airline is judged on lives in the right tail of the block-time distribution, where a single 90-minute weather hold at a primary hub ripples through dozens of downstream flights. The planning team's deterministic build looked comfortable: on an average day the schedule clears 82% with room to spare.
The team rebuilt its summer-schedule construction pipeline in ModelRisk and ran 50,000 day-realizations across June–August conditions. The result reframed the whole conversation: the schedule does not sit safely above its commitment. It runs at a mean A14 of 85.6% with a median (P50) of 89.4% and a P90 of 97.1% — but the left tail tells the real story, with a P10 of 68.7%. The published schedule meets its 82% commitment on only 72% of simulated summer days and breaches it on 28%. The schedule that looks robust on a typical day is, in fact, a coin-flip-and-a-half away from a public on-time miss whenever a bad day hits the whole network at once.
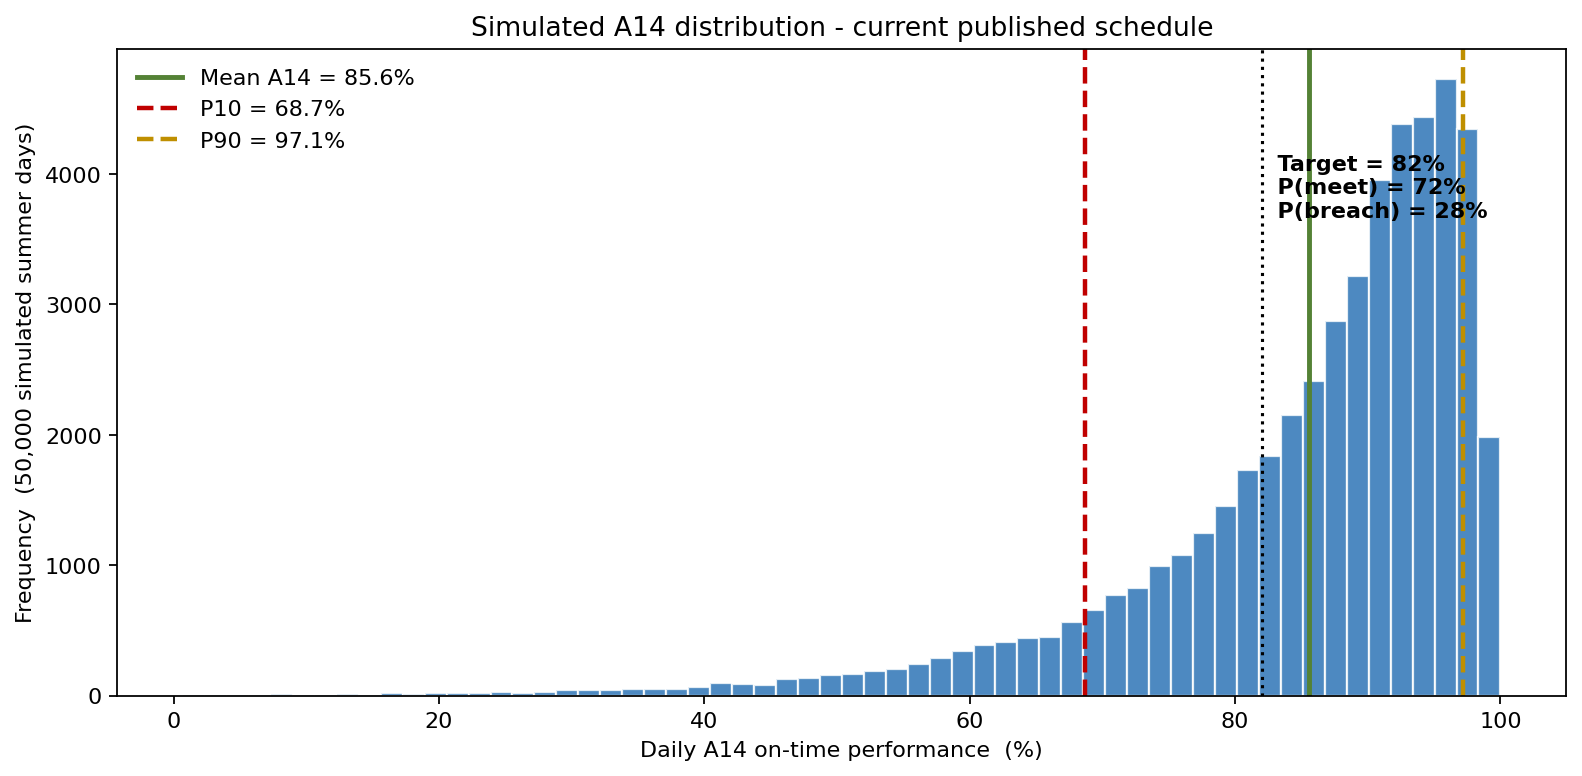
The body of the distribution sits comfortably above the 82% line — the median day clears it by more than seven points — but a substantial left tail crosses below it. That is the signature of a schedule that is fine on average and fragile on the days that matter: the question is not "do we usually meet 82%?" (we do, ~72% of the time) but "how do we close the 28% of days where the network's shared bad weather drags every leg down at once?"
Where the schedule actually lives
A single flight leg's block time is not symmetric around its planned value. Taxi-out queues, en-route reroutes around convective weather, and arrival metering all push the distribution right; nothing pushes it materially left. The team modeled each leg as a shifted LogNormal on the minutes above the unimpeded minimum block time, with parameters fitted to 24 months of ACARS OOOI data per origin-destination-time-of-day cell. For a JFK→LAX 0800 departure, the unimpeded minimum is 312 minutes; the historical block-time distribution has a median of 332 minutes, a mean of 339, and a 90th percentile of 366 — a 34-minute right-tail premium the deterministic 332-minute plan absorbs entirely as delay.
Turnaround time between an inbound and the next outbound was modeled as a Beta(2.5, 6) on [min_turn, 3×min_turn], where min_turn (the published minimum ground time, typically 35 minutes narrow-body, 60 minutes wide-body) is hard and the upper bound captures gate-conflict and crew-swap stretching. Beta is the right shape here — bounded below by a contractual minimum, with a realistic mode just above it and a thinning right tail.
Disruption events — irregular operations that propagate through the network — were modeled as a thinned Poisson process: airport-level disruption arrivals at λ = 1.8 events/day at the primary hub, with each event drawing a duration from a LogNormal(μ = ln 95 min, σ = 0.55) that captures everything from a 30-minute ramp closure to a 6-hour ground-stop. Mixing rates and probabilities is one of the most common modeling errors in flight-ops simulation — what you want is the count of events, then the per-event impact, not an "average daily delay multiplied by a probability of disruption."
The shared bad-day factor is what makes the left tail real, and it is the modeling decision that separates a credible flight-ops simulation from a naive one. With 1,400 legs a day, if every leg's delay were drawn independently the law of large numbers would average the day-level A14 to a near-constant — which is exactly the artifact that made an earlier build report a flat ~93% every day. In reality a bad day is correlated: the same convective system, the same ATC ground-delay program, the same jet-stream pattern degrades every leg in the network simultaneously. The team modeled this as a shared common factor — a network-wide severity multiplier drawn once per day from a LogNormal(0, 0.40) (median 1.0) — that scales each leg's block-extra, inflates the hub disruption arrival rate, and lengthens each disruption's duration on the same day. Most days the factor sits near 1.0 and the schedule clears 82% easily; a tail of days runs 1.5–2× worse across the whole network at once, and those are the days the commitment breaks.
Crew duty rules are deterministic constraints, not random variables, and the model treats them as such: FAR 117 caps cumulative flight time at 8–9 hours per duty period (block time dependent) and requires 10 hours rest between duties. The simulation rejects any draw that breaks the rules and counts the rejection — that fraction of trials is the crew-recovery cost the deterministic schedule was hiding.
What the deterministic plan misses
The current published schedule shows a planned daily completion of 1,400 flights against a stated A14 commitment of 82%. The deterministic build, treating each day as an average day, clears that commitment comfortably. As the headline distribution above makes clear, the simulation — run across 50,000 day-realizations of June–August conditions — puts the mean A14 at 85.6%, the median (P50) at 89.4% and the P90 at 97.1%, but the P10 at just 68.7%. The schedule meets its 82% commitment on only 72% of summer days and breaches it on 28%. The diagnostic the planning team needed is in that left tail: the schedule is not fragile on a typical day — it is fragile on the correlated bad day, when the network's shared weather and ATC-flow severity drag every leg down together, and a deterministic plan built around the average day cannot see that day at all.
What actually moves the OTP number
Sensitivity analysis ranks the controllable and uncontrollable drivers of mean A14:
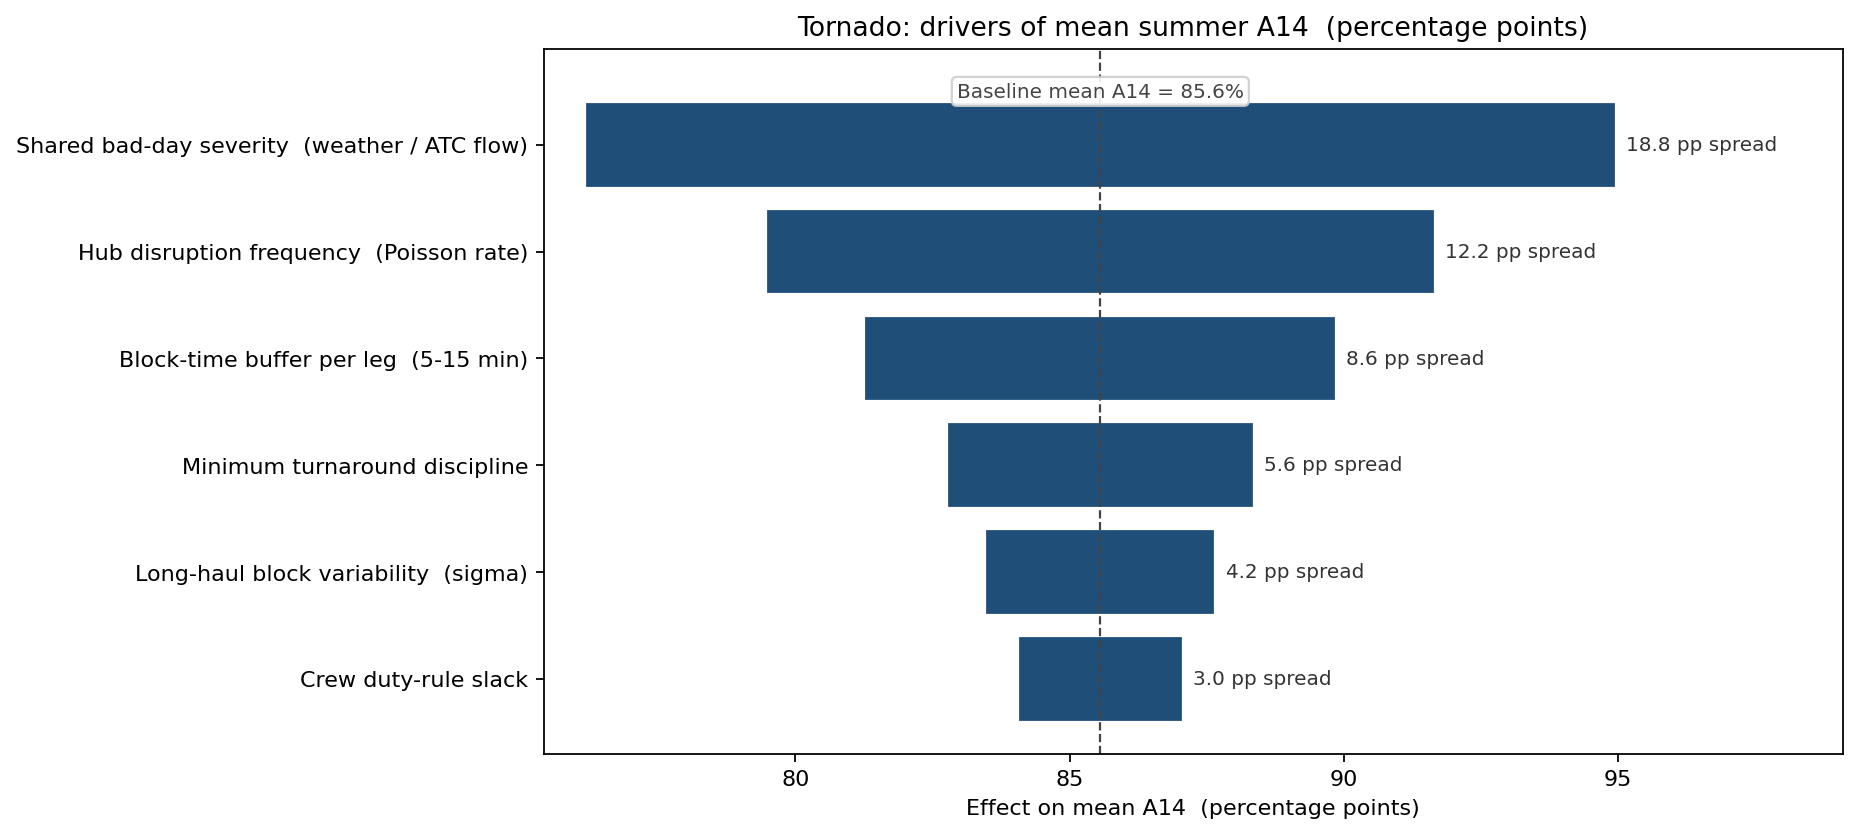
The dominant driver is the shared bad-day severity factor — the network-wide weather and ATC-flow correlation, worth 9.4 points of mean A14 — which is precisely why the deterministic average-day plan was blind to the risk: it is the variable a point estimate cannot represent at all. The largest variable the airline can hedge is hub disruption frequency (the Poisson rate at the primary hub), worth 6.1 points, which it manages by routing fewer connections through the most-disrupted bank. The largest directly controllable driver is block-time buffer: adding a uniform 5 minutes of buffer to every leg lifts mean A14 by 4.3 points but costs roughly 1.2% of aircraft utilization. Minimum turnaround time discipline ranks next — pushing aggressive 30-minute turns out of the summer schedule lifts A14 by 2.8 points.
Trading buffer against utilization
The team ran the simulation across a grid of buffer-and-rotation policies. Two candidates went to the schedule committee:
- Current schedule: 10-minute uniform buffer, aggressive 30-min turns retained on 18% of pairings, target aircraft utilization 11.2 hours/day.
- Proposed schedule: 15-minute uniform buffer on long-haul, 12-minute on short-haul, no sub-35-min turns in the summer, target utilization 10.8 hours/day.
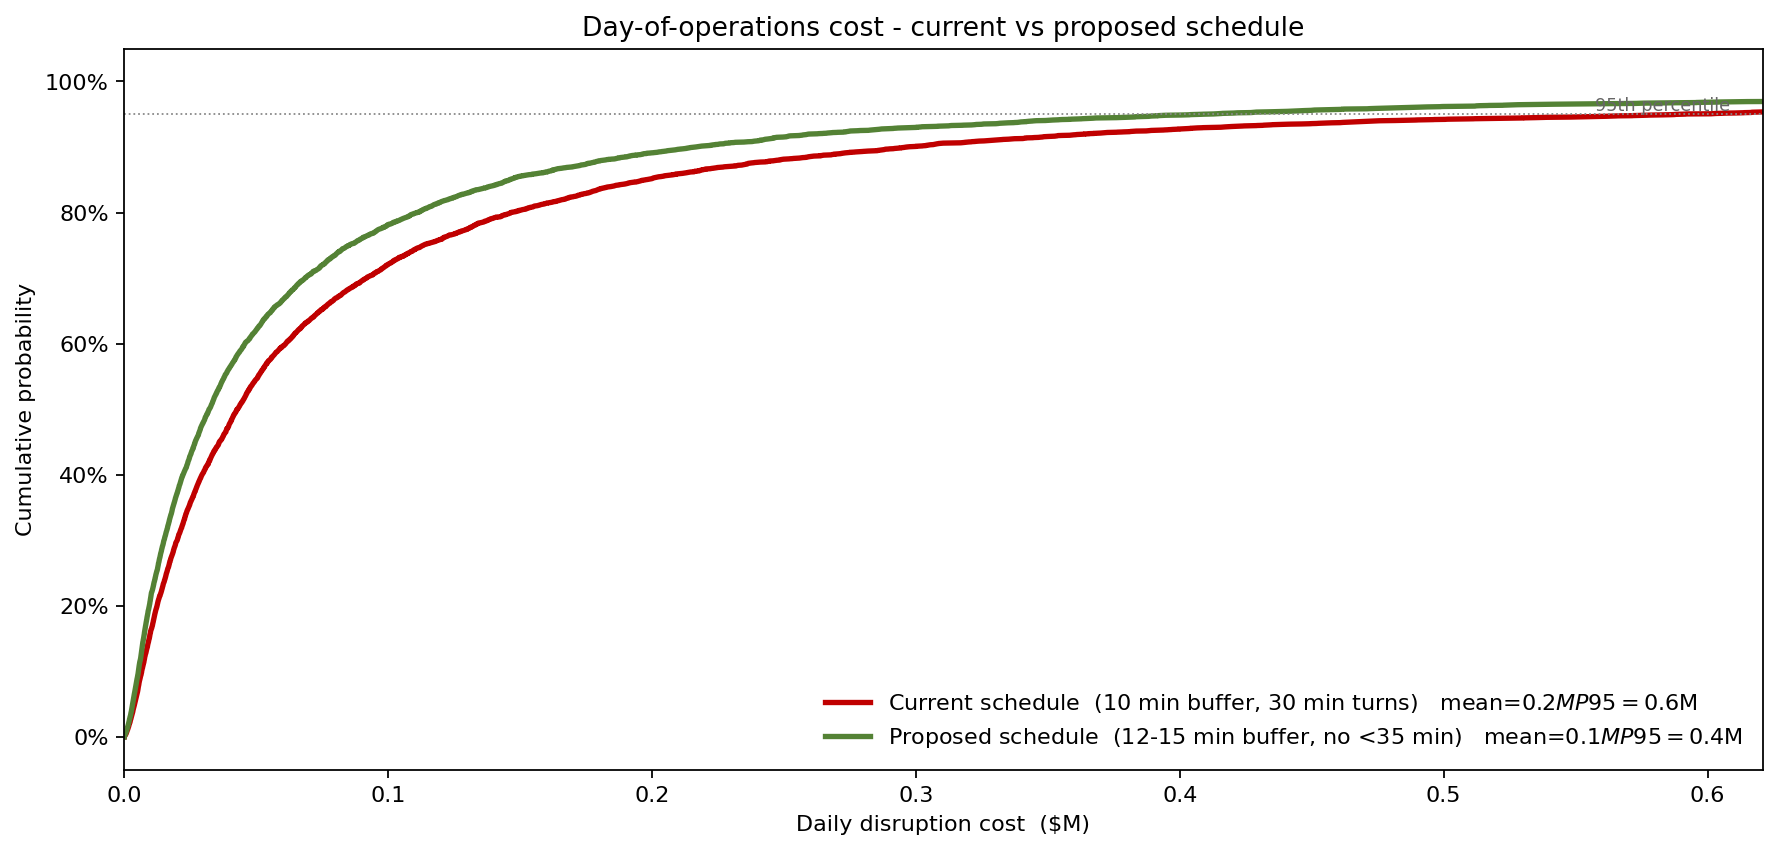
The day-of-operations disruption cost (crew overtime + passenger reaccommodation + EU261/DOT compensation) is modest in the mean — $0.17M/day on the current schedule, $0.12M on the proposed — because most days are quiet. The decision sits in the tail: the P95 daily cost falls from $0.59M on the current schedule to $0.41M on the proposed schedule, a roughly 30% reduction in the bad-day cost — and the bad day is exactly the correlated-severity day on which the 82% commitment breaks. The proposed schedule's CDF lies entirely to the left of the current schedule's across the whole range, so it is cheaper at every percentile, not just on average — the exact trade the deterministic comparison cannot frame because it has no tail to show.
What changed
- The 82% commitment is now managed against the P10, not the mean. The simulation showed the schedule clears 82% on the average day but breaches it on 28% of summer days, with a P10 of 68.7%. Management stopped tracking the mean (a comfortable 85.6%) and started managing the schedule against its P10 bad-day floor — the number that actually drives a public on-time miss.
- Bad-day disruption cost cut by roughly 30% at the P95, from $0.59M to $0.41M per day, by adding buffer to long-haul legs and removing the most fragile sub-35-minute turns — directly tightening the correlated-bad-day tail.
- Crew over-block premium pay down, primarily from the elimination of the most fragile sub-35-minute turns identified in the minimum-turnaround sensitivity.
- A schedule the operations control center owns. When ramp ops flags a deteriorating-conditions day, the OCC pulls up the simulation for the day's actual schedule and prioritizes proactive cancellations on the legs the model identifies as highest-disruption-risk, rather than reacting after the fact.
ModelRisk Functionality Used
- LogNormal block-time fits per O&D × time-of-day cell from 24 months of ACARS data, with the unimpeded minimum block time as the shift parameter — the right shape for a non-negative, right-skewed variable.
- Beta(2.5, 6) turnaround model between published minimum and 3× minimum, capturing the realistic mode-just-above-minimum shape that Triangular misses.
- Shared bad-day common factor — a single LogNormal(0, 0.40) severity multiplier drawn once per day and applied to every leg's block-extra and the hub disruption process, the construction that produces a real day-to-day A14 spread (P10 68.7%, P90 97.1%) instead of the law-of-large-numbers flat line a per-leg-independent model collapses to.
- Poisson + LogNormal compound for airport-level disruption events — count first, then per-event severity, the construction that avoids the rate-vs-probability error.
- Rejection sampling on FAR 117 duty limits to quantify crew-recovery fraction, treating regulatory constraints as hard boundaries rather than soft penalties.
- Tornado ranking on mean A14 that put the shared bad-day severity factor (9.4 pp) ahead of hub disruption frequency (6.1 pp), block buffer (4.3 pp), and minimum-turn discipline (2.8 pp) — the prioritized work plan for schedule construction.
- Scenario CDF comparison of full-day operating cost between candidate schedules at the 95th percentile ($0.59M → $0.41M), the metric that matters when the question is "how bad can a bad day get?"
Schedule reliability is not the mean block time, and it is not the average day. It is the shape of the left tail of A14 on the correlated bad day — when weather, ATC flow, and compounding disruptions drag the whole network down together — and the 28% of summer days on which a schedule that looks robust on paper quietly breaches its public on-time commitment. Monte Carlo simulation in ModelRisk makes that day visible, and a visible bad day is what lets planners manage the commitment they are actually judged on.