

Industry: Aerospace
Product: ModelRisk
Application: Stochastic Aircraft and Crew Routing Under Disruption
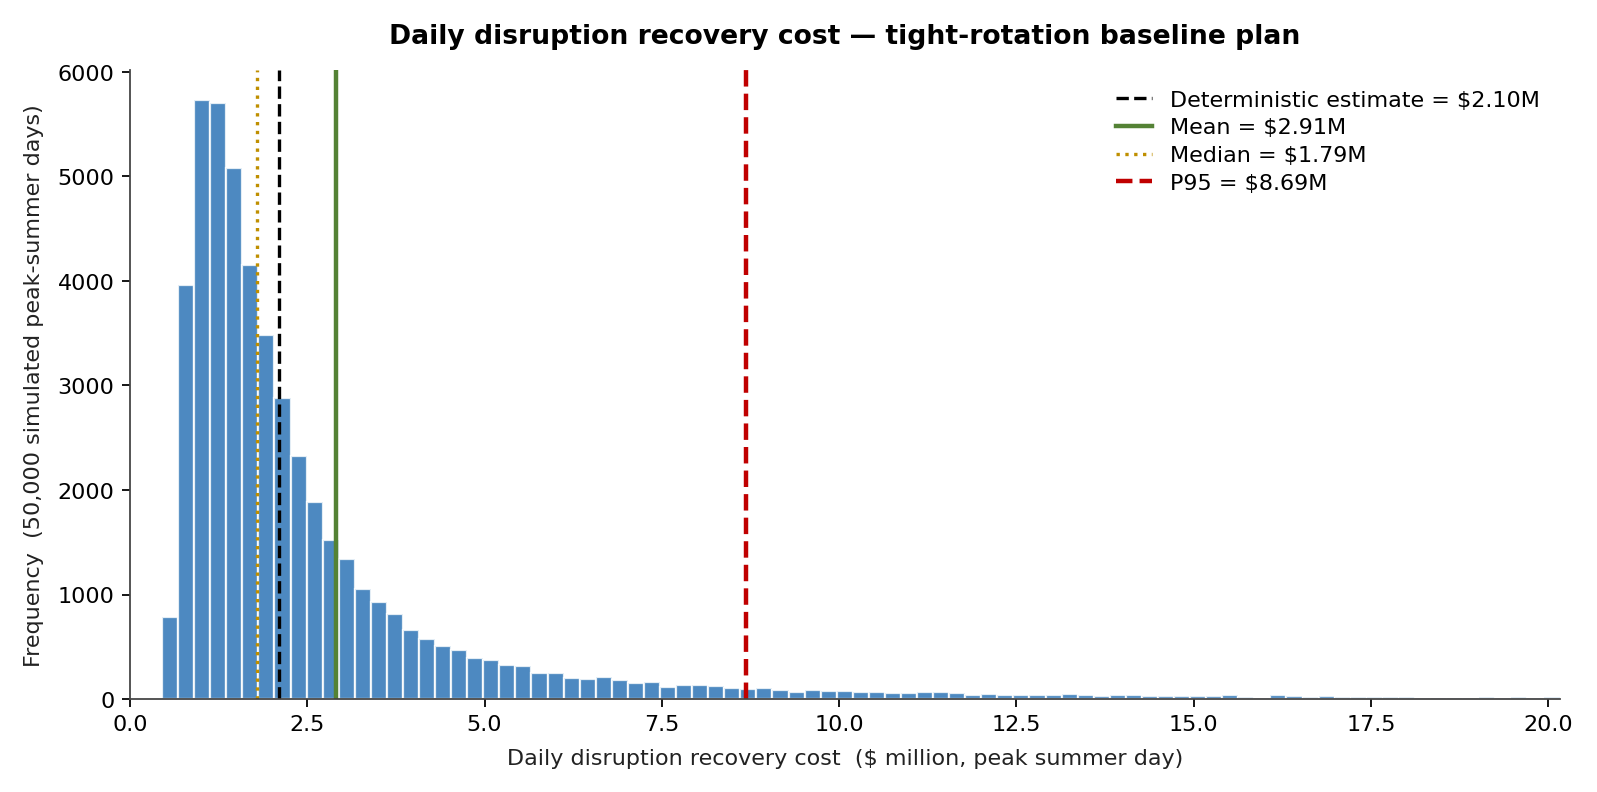
The deterministic plan prices a peak day at $2.1M; the simulation puts the mean at $2.91M and the P95 at $8.69M — and the cheapest-nominal rotation is not the one with the thinnest tail
A US legacy carrier running 1,180 mainline departures per day measures system-wide network resilience in propagated delay minutes. When a Category-2 thunderstorm closes JFK ground operations for 90 minutes on a peak afternoon, the immediate hit of delayed flights cascades through aircraft, crew, and gate dependencies for another 36 hours. A deterministic routing plan that ranks the highest network-utilization rotation on top prices that storm at a single point estimate — $2.1M per peak day in passenger compensation and crew overtime.
The Monte Carlo recovery simulation, run across the documented 2019–2024 disruption catalogue with realistic frequency, replaces that single number with a full daily cost distribution. The same tight-rotation baseline plan carries a mean of $2.91M and a long right tail to a P90 of $5.47M and a P95 of $8.69M per peak-summer day. The deterministic $2.1M does not sit "in the middle" of that distribution — the simulated mean is 39% higher than the point estimate, because the point estimate prices a typical day and ignores the convex cascade that a disruption day triggers across the rotation and crew-pairing graphs.
Modeling disruption as a stochastic process
The disruption catalogue underpinning the model captured four event families with distinct frequency-severity signatures:
- Convective weather closures — Poisson rate of 0.18 events/day per major hub during May–September, severity (closure duration in minutes) modeled as LogNormal (median 52 min, σ_log 0.85). Five major US hubs were correlated through a Gaussian copula: a thunderstorm at LGA raises the probability of a near-simultaneous event at JFK and EWR (ρ = 0.62).
- ATC slot restrictions — Poisson rate 0.42 events/day, severity Triangular(15, 35, 90 min). Often coincident with weather but modeled with explicit conditional probabilities.
- Mechanical AOG events — per-aircraft Poisson rate of 0.011 events/day (3.7/year), severity LogNormal (median 4.2 hours to release, σ_log 0.54). Tail events to 30+ hours captured explicitly.
- Crew availability events — sick calls and timed-out crew combined into a daily count modeled as Negative Binomial (mean 8.4 events/day across the network, dispersion 2.1) — over-dispersed relative to Poisson because crew issues cluster around irregular operations.
The four families were tied together by a shared disruption-day common factor — a single latent irregular-operations intensity drawn once per simulated day (Gamma, mean 1.0, right-skewed) that lifts the weather rate, the storm severity, the ATC and AOG counts, and the crew-event count together. Without it, the four independent processes average out (a central-limit collapse to a tight bell around the deterministic point) and the simulation simply reproduces the planning sheet. With it, bad days cluster — weather, ATC, mechanical, and crew problems pile onto the same days — which is exactly the empirical signature of an irregular-operations day and the source of the right tail.
Each event triggered a downstream propagation simulation. The propagation engine walked the aircraft rotation graph — each tail-number-rotation is a chain — and the crew pairing graph, and accumulated delays at every node where the stored slack was insufficient to absorb the upstream delay. Below a rotation's slack threshold a closure is contained (cost grows roughly linearly); above it the closure cascades convexly — each residual closure-minute cancels a flight whose tail then mis-connects downstream — which is why a plan's slack, not its average delay, determines its tail.
Per-event recovery cost
For each simulated event chain, the cost was:
\[ C_{\text{event}} = C_{\text{pax}} + C_{\text{crew OT}} + C_{\text{hotel}} + C_{\text{rebook}} + C_{\text{cxl}} \]
with per-pax compensation triggered above 3-hour delay at $185/pax (LogNormal around DOT compensation rules), crew overtime at $148/hour above pairing limits, hotel cost LogNormal at $215/pax for overnight reaccommodation, and cancellation cost at $34k for a narrow-body and $128k for a wide-body cancellation. Per-pax loads were drawn from a Beta(7.5, 2.5) on the [0.55, 0.95] load-factor range, fitted to the route.
50,000 simulated peak-summer-days produced the cost distribution per candidate routing plan, shown in the opening chart.
What the recovery cost distribution looks like
Mean daily recovery cost under the tight-rotation baseline plan: $2.91M. The distribution is heavily right-skewed — median $1.79M, P90 $5.47M, P95 $8.69M — the median sits below the mean and below the deterministic point because most peak days are quiet, but the disruption days that cluster weather, ATC, mechanical, and crew events compound across the network into a long tail. The deterministic estimate at central inputs was $2.1M: it is not a conservative number, it is 39% below the simulated mean and a fifth of the P95 the plan actually carries.
Comparing three routing strategies
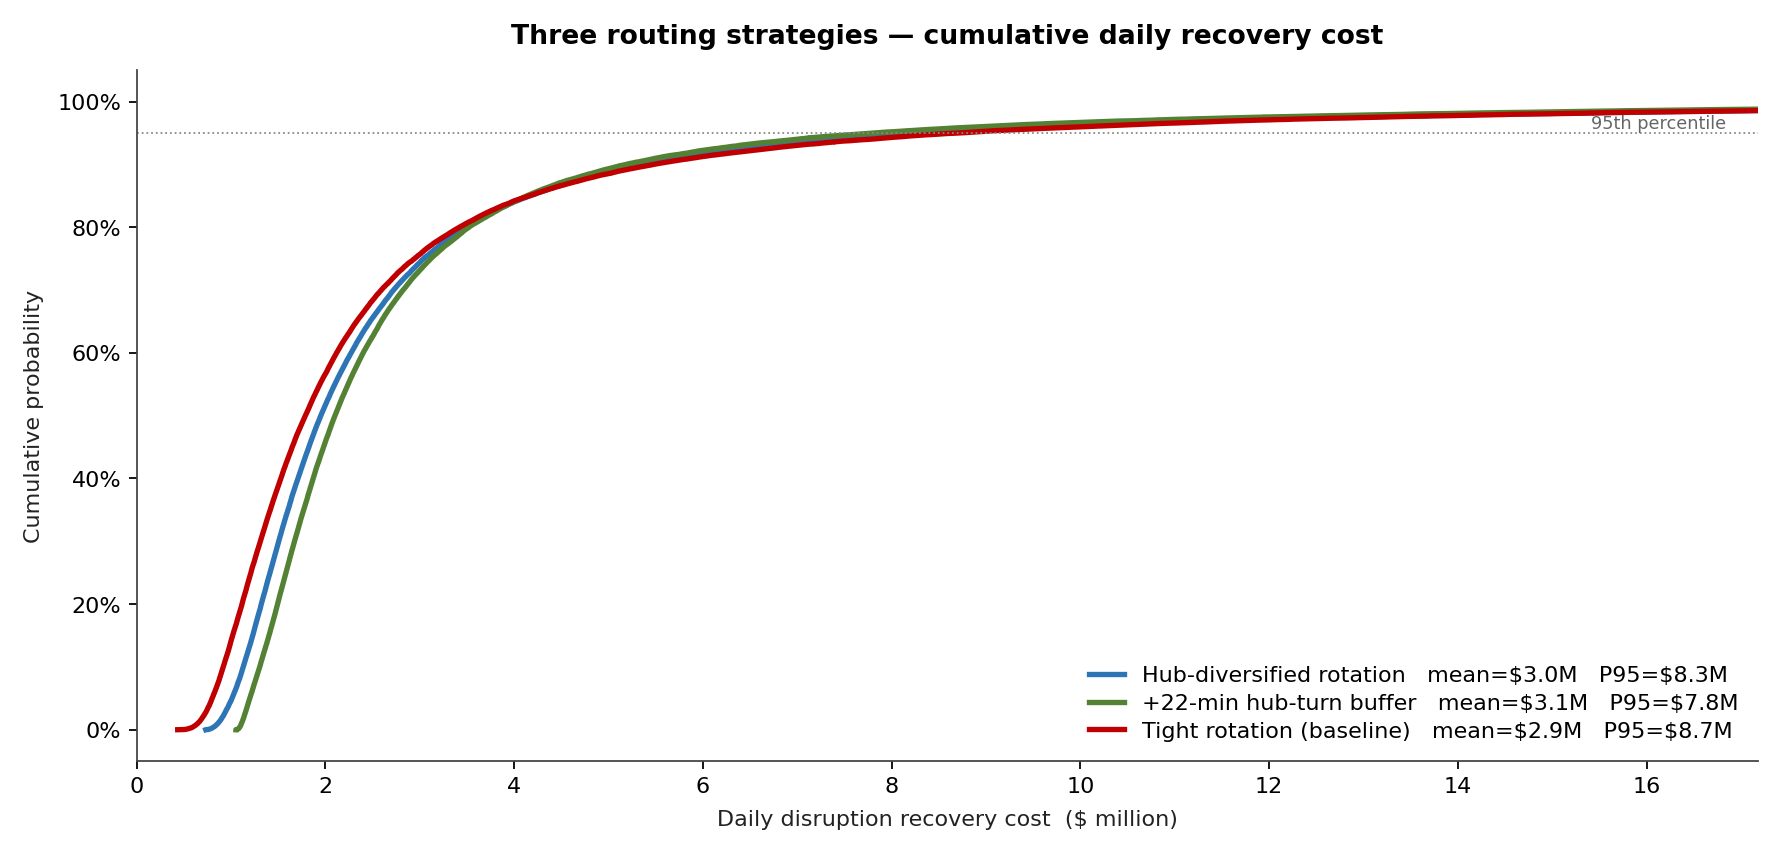
The three plans separate on the tail, not on the body — and the cheapest-nominal plan is not the lowest-tail plan, which is the whole decision:
- Tight rotation (no carried slack): mean utilization 11.2 hours/day. Cheapest on the nominal day — median $1.79M, mean $2.91M — but the worst tail: P90 $5.47M, P95 $8.69M. With almost no slack, a single disruption day cascades hardest.
- +22-min buffer at hub turns: mean utilization 10.6 hours/day. Most expensive nominally — median $2.10M, mean $3.07M — but the thinnest tail: P90 $5.18M, P95 $7.81M. The carried slack absorbs the first chunk of every closure before it can cascade, so the buffer plan's P95 sits $0.88M/day below the tight plan's. That is the tail it buys down, paid for in foregone block-hour revenue.
- Hub-diversification rotation: tail-numbers rebalanced so no single tail flies more than 2 consecutive JFK turns and cross-hub weather correlation drops from 0.62 to 0.32. A middle trade — median $1.95M, mean $3.03M, P90 $5.36M, P95 $8.32M.
A planner ranking on mean or median picks the tight rotation. A planner who has to fund the disruption reserve picks the buffer, because $8.69M vs $7.81M at the P95 is the number that lands on the balance sheet one summer in twenty.
What drives the recovery cost tail
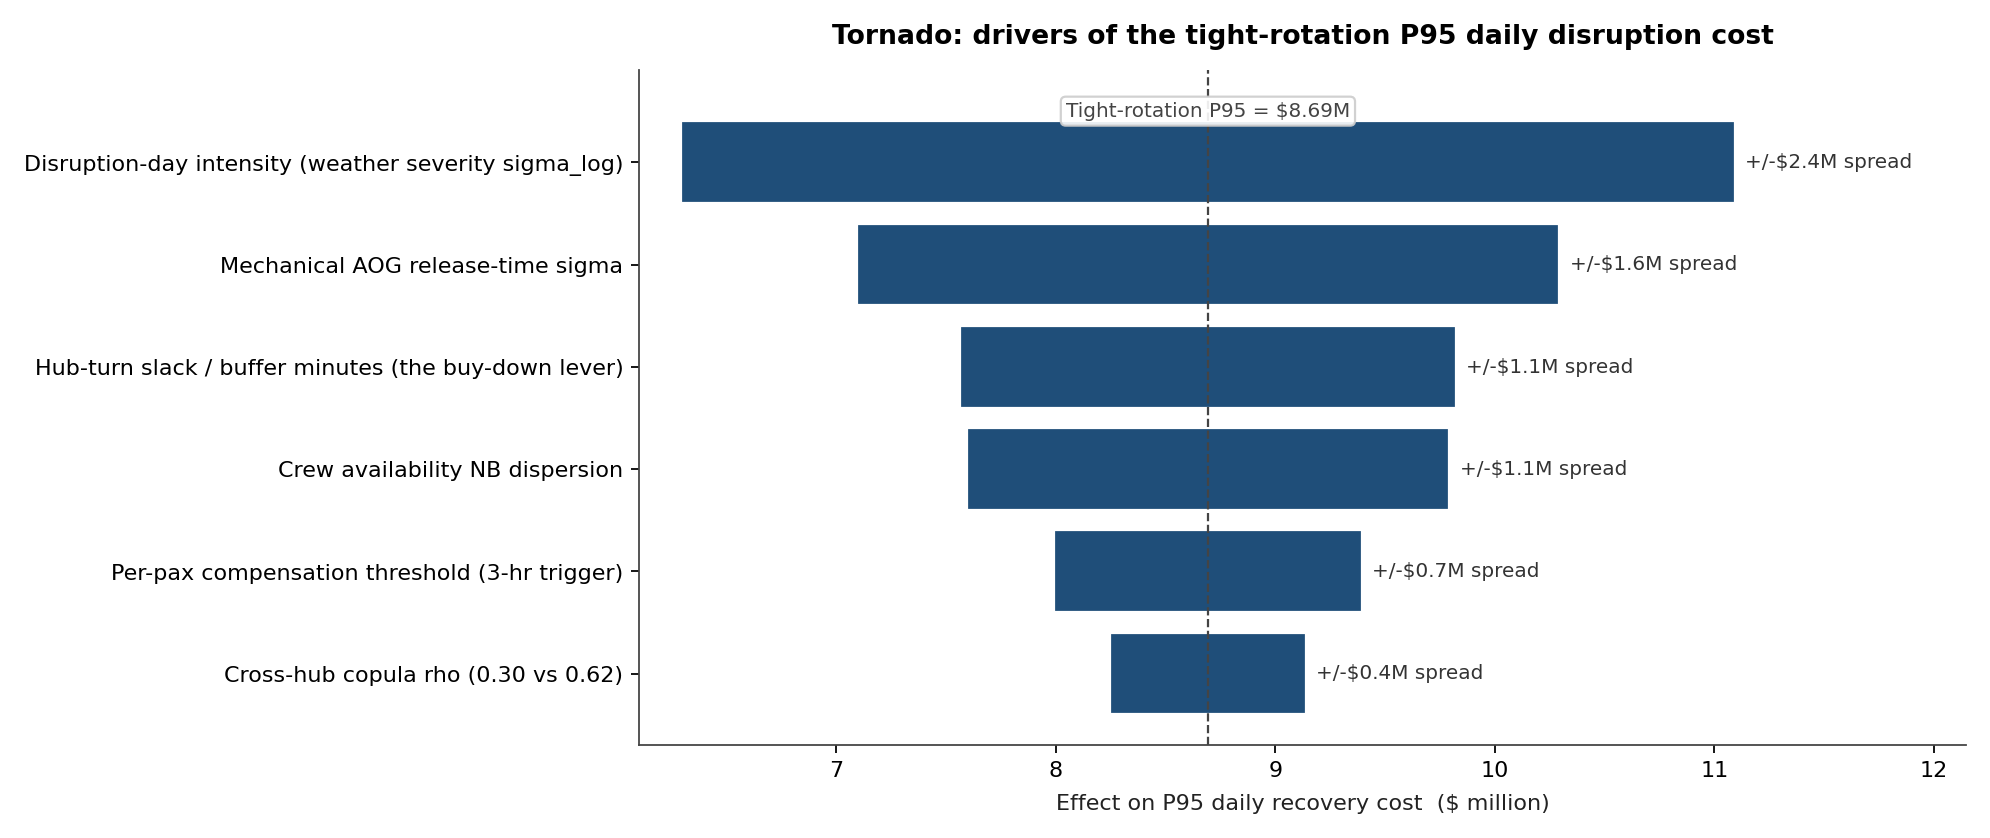
The tornado is run on the P95 tail of the tight plan ($8.69M), because the tail — not the mean — is what the buffer-versus-tight decision turns on. The dominant mover is the disruption-day intensity / convective-weather severity (σ_log), with a P95 spread of $2.40M: fatter-tailed closures on high-intensity days cascade further. The mechanical-AOG release-time spread is $1.60M and crew-availability dispersion $1.10M. The controllable lever is hub-turn slack — swinging it across its range moves the P95 by $1.13M, which is precisely the buffer plan's advantage made visible. Cross-hub copula ρ is a second-order driver here (spread $0.44M): once the shared disruption-day factor is in the model, most of the day-to-day clustering comes from that common intensity, and the residual hub-to-hub correlation adds comparatively little.
What the model changed
- The 22-minute hub-turn buffer was institutionalized on the eight highest-disruption-cost rotations, with a published exception process for off-peak shoulder days — chosen not because it is cheapest (it is the most expensive on a nominal day, median $2.10M vs the tight plan's $1.79M) but because it cuts the P95 from $8.69M to $7.81M, the number the disruption reserve is sized against.
- The crew-pairing optimizer was reconfigured to penalise pairings that depend on tight JFK / LGA / EWR connections during May–September.
- The carrier's disruption-recovery cost reserve was rebuilt against the simulated P95 of the tight plan ($8.69M/peak day) rather than the historical mean — a tail the deterministic $2.1M planning sheet had never surfaced.
- The OCC (Operations Control Center) recovery-priority algorithm was rewritten to prioritise rotations whose downstream propagation tree had the highest simulated impact — not the rotations with the highest direct passenger count, which had been the prior rule.
ModelRisk Functionality Used
- Shared disruption-day common factor — a single latent irregular-operations intensity drawn per day that lifts weather, ATC, mechanical, and crew processes together. This imposed correlation is what produces the clustering and the right tail; without it the four processes average to a tight bell around the deterministic point and the simulation adds nothing.
- Negative Binomial for crew-availability events, replacing the prior Poisson model that under-counted the over-dispersed cluster days (dispersion 2.1, not 1).
- Gaussian copula across the five major hubs' convective-weather processes (ρ=0.62 measured 2019–2024) — a second-order driver once the disruption-day factor is in the model, but still the difference between the diversified plan's P95 and the tight plan's.
- Compound disruption simulation that walks the rotation graph and crew-pairing graph, accumulating delay at every dependency node where slack is insufficient — with a convex cascade above each rotation's slack threshold.
- Strategy-CDF comparison ranking three routing plans on the full cost distribution, not the mean — the +22-min-buffer plan loses on the median ($2.10M vs $1.79M) but wins where it counts, $7.81M vs $8.69M at the P95.
- Tornado on the P95 tail showing the disruption-day intensity as the dominant mover and hub-turn slack as the controllable buy-down lever — the analysis that justified buffering the eight worst rotations.
A routing plan tuned against mean recovery cost looks cheapest right up until the summer it isn't: the tight rotation saves $0.31M on the median day and costs $0.88M extra at the P95 — and the chief financial officer only ever sees the second number, one summer in twenty, on a planning sheet that priced the storm at $2.1M.