

Industry: Aerospace
Product: ModelRisk
Application: Fleet Renewal and Aircraft Procurement Decisions
A fleet renewal where the right to walk away from half the order is the deciding factor
A regional carrier evaluating a 40-aircraft narrow-body renewal at roughly $55M net per tail had to choose between three commitments: firm-order all 40 now at the launch-customer discount, firm-order 20 plus 20 purchase rights exercisable at year 3, or sign a 12-year operating lease portfolio at 0.96% of capital cost per month. A deterministic NPV analysis at central inputs ranks the options on a single number and hides what happens when demand and fuel move together against the program.
The Monte Carlo analysis ranks the 20+20 with purchase rights structure on top on a risk-adjusted basis: its mean NPV of $1.44B is the highest of the three ownership-style structures, and — crucially — the right to cancel the second tranche almost halves the downside, holding its P10 at –$1.17B against the firm-40 commitment's –$2.91B. The chart below conditions each structure's mean NPV on the year-3 demand level — the green band is the value of being able to walk away.
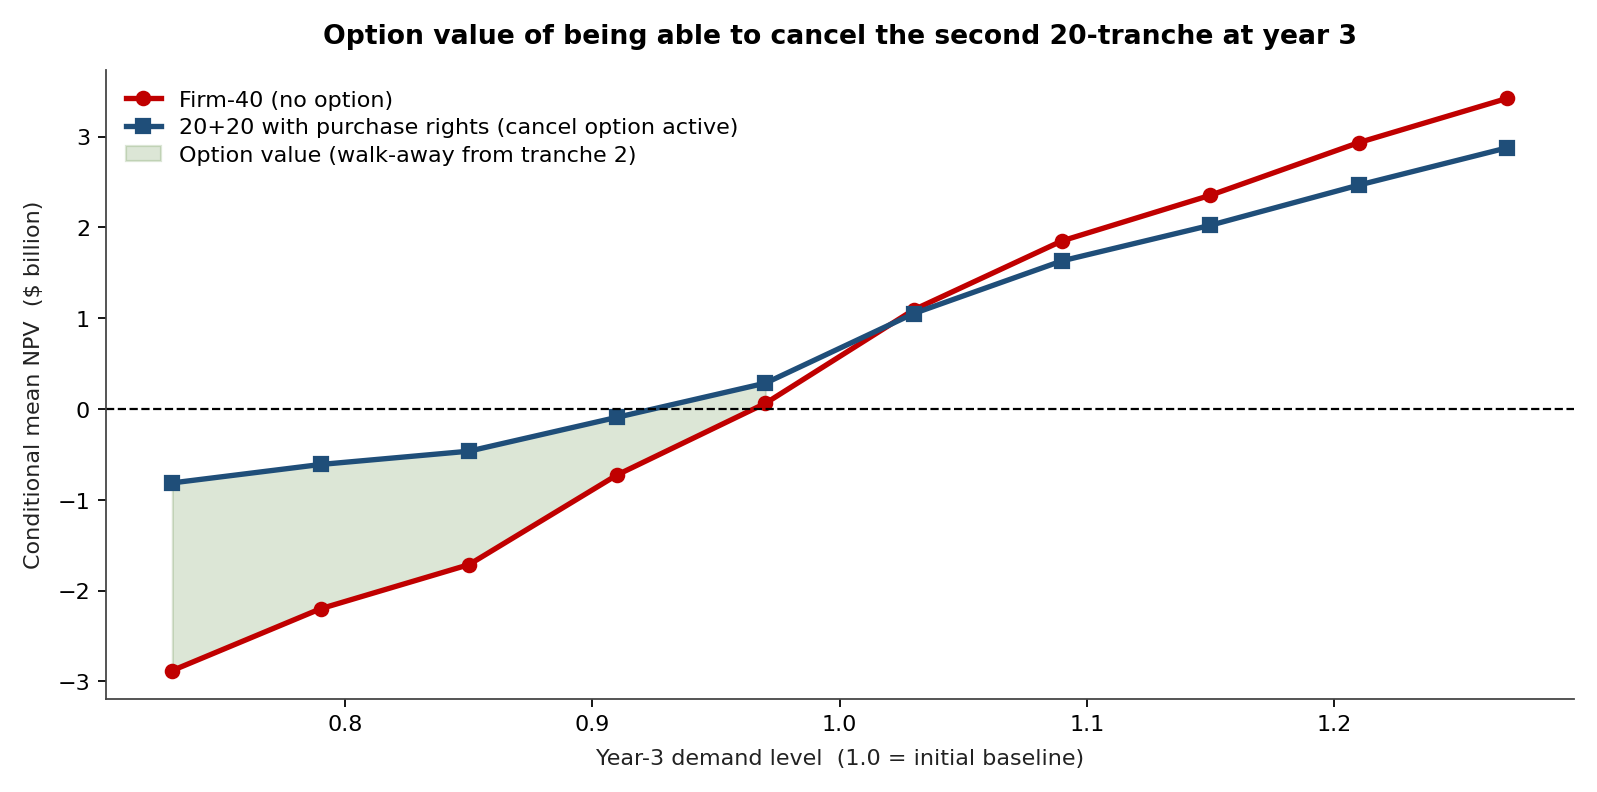
When year-3 demand lands below the 1.0 baseline, the firm-40 line (red) drops away from the 20+20 line (blue): committing to all 40 aircraft locks in the worst paths and carries idle-capacity drag the carrier cannot shed, while the purchase-rights structure cancels the second tranche and avoids them. At a year-3 demand of around 0.73, firm-40's conditional mean NPV is about –$2.88B while the 20+20 structure holds near –$0.81B. As year-3 demand recovers above 1.0, the two converge and firm-40 edges ahead — the option is worth little when demand is strong, which is exactly the property a real option should have.
Modeling the three uncertainties that move fleet NPV
Passenger demand growth — the carrier's network. Modeled as regime-switching rather than Normal: a "growth regime" (mean RPK growth 4.5%/yr, σ 3.0%) and a "shock regime" (mean −7%/yr, σ 10%) with a 10%/year switching probability, calibrated against the 2001, 2009, and 2020 demand shocks. A pure Normal would have under-priced the shock-regime tail by an order of magnitude.
Jet fuel price — modeled as a two-regime jump-diffusion (low-vol drift 2%/yr, σ 22%; crisis-vol drift 5%/yr, σ 48%) with 11%/year switching. A geometric Brownian motion fitted to the last 10 years had been the planning department's prior model; it produced symmetric forecasts with a P99 of $124/bbl. The regime-switching model produced a P99 of $186/bbl, reflecting the actual 2008 and 2022 episodes.
Aircraft residual value at year 12 — modeled as a mixture distribution: 75% probability of "healthy used market" (LogNormal median 43% of net acquisition price, σ_log 0.18); 25% probability of "depressed market" (LogNormal median 22% of net price, σ_log 0.30). The mixture probability itself was correlated (ρ=0.55, Gaussian copula) with the demand-regime indicator — bad demand drives both ownership cost and residual value the wrong way at once. This correlation was a leading reason firm-ordering all 40 looked worse under simulation than under point estimates.
Lease rate — for the lease-portfolio option, modeled as a stochastic monthly rate factor with 18% volatility around the contracted 0.96%, plus an index-linked reset escalator that ratchets the rate up in weak-demand states — the clause that gives the lease its recurring downside in exactly the periods the carrier can least afford it.
The NPV simulation
For each procurement option, the model ran 25,000 12-year cash-flow paths discounted at 8.5%. The cash flow per aircraft per year was:
\[ \text{CF}_t = R_t - C_{\text{fuel},t} - C_{\text{maint},t} - C_{\text{crew},t} - C_{\text{ownership},t} \]
with revenue R_t driven by the demand simulation × yield × capacity, fuel cost driven by the fuel-price simulation, and ownership cost set per option. A single economy-wide macro common factor was drawn once per trial and tilted both the demand and the fuel-crisis regimes together, so all 40 tails and all 12 years move with one underlying state — the correlation that gives the aggregate its real width rather than a central-limit collapse toward the mean.
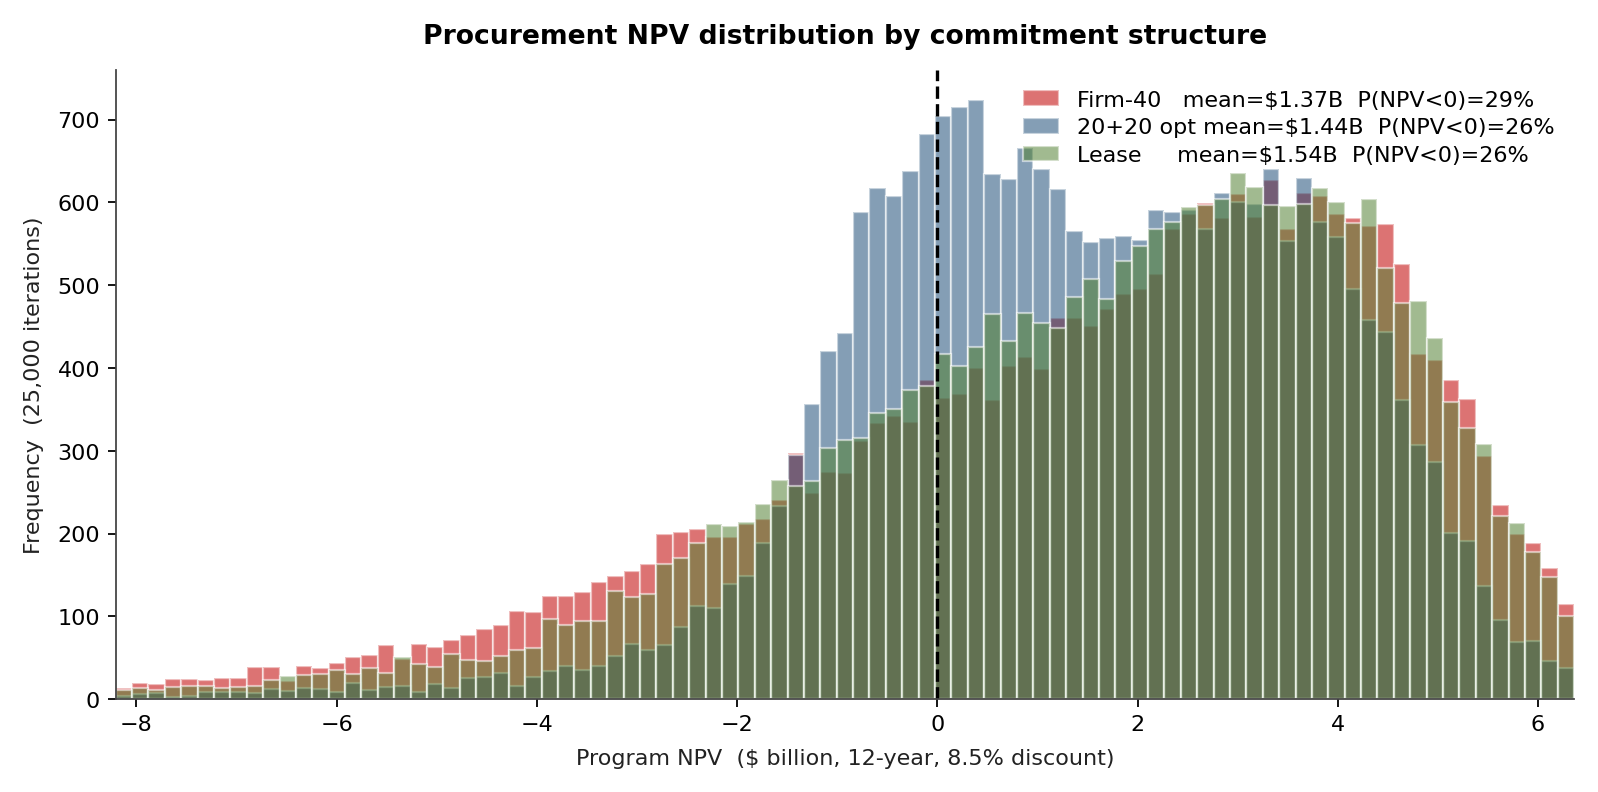
- Firm-order 40 now: mean NPV $1.37B, P10 –$2.91B, P50 $2.07B, P90 $4.96B, P(NPV < 0) = 29%. The deepest bottom tail of the three — committing to all 40 tails means carrying idle-capacity drag (financing, storage, slot cost) on parked aircraft the carrier cannot shed when the shock-regime demand × high-vol fuel × depressed-residual states hit together.
- 20 firm + 20 purchase rights: mean NPV $1.44B, P10 –$1.17B, P50 $1.48B, P90 $4.33B, P(NPV < 0) = 26%. The highest mean of the three and, decisively, the best worst case: the right to skip the second tranche cuts the P10 loss roughly in half versus firm-40.
- Lease 40: mean NPV $1.54B, P10 –$2.24B, P50 $2.10B, P90 $4.93B, P(NPV < 0) = 26%. Marginally the highest median, but the index-linked rate reset ratchets the lease cost up in exactly the weak-demand states that hurt most, and the structure forgoes the residual-value upside an owner keeps — leaving a worse downside than the staged-option structure.
The option value of waiting
The 20+20 structure's advantage over firm-40 isn't a single headline number — it lives in how the two diverge across the year-3 demand range, shown in the opening chart. The model prices the right to walk away from the second tranche by computing NPV conditional on the year-3 information set.
When year-3 demand sits at the low end (below 0.80 of baseline), the firm-40 conditional mean NPV is about –$3.21B while the 20+20 structure holds near –$0.91B — the cancel option avoids roughly $2.3B of downside at that information state. The gap closes as demand recovers past baseline. The firm-40 commitment has no equivalent option and accepts the low-demand downside unconditionally.
What drives the NPV variability
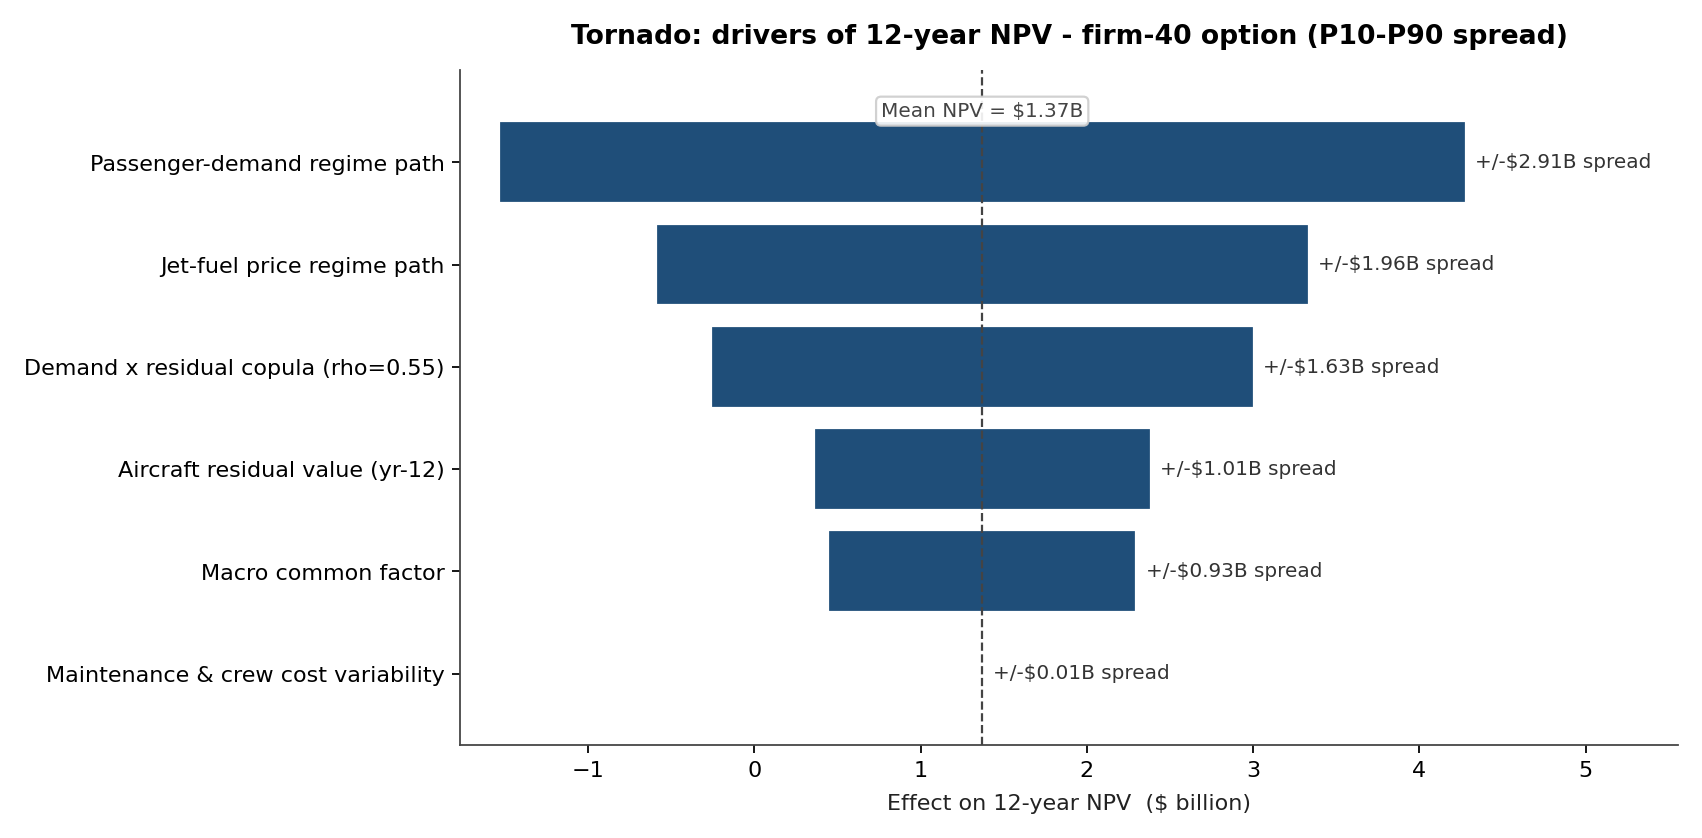
The passenger-demand regime path is the largest driver (≈±$2.91B half-spread). Jet-fuel price is second (≈±$1.96B). Third is the copula between demand and residual value (≈±$1.63B, a $3.26B P10–P90 spread) — a joint demand-residual tail that an independence-assuming model would have missed entirely. The point-estimate analysis collapsed all of this to single inputs and never surfaced the correlated downside that makes the firm-40 commitment the riskiest structure.
What the model changed
- The board approved the 20+20 with purchase rights structure on the basis of its conditional NPV profile and explicit option value — its mean NPV ($1.44B) is the highest of the three structures and, decisively, its P10 of –$1.17B is roughly half the firm-40 downside of –$2.91B. The right to cancel the second tranche caps the low-demand loss that the firm-40 commitment accepts unconditionally.
- The carrier negotiated a fuel-pass-through clause into the operating cost recovery sub-agreement with its codeshare partners, sized against the high-vol regime tail rather than the low-vol baseline.
- Year-3 exercise decision was tied to a published decision rule: exercise the second tranche if the rolling 18-month RPK growth is in the upper half of the growth-regime forecast and fuel is below the high-vol regime threshold.
- The internal NPV-modeling standard was rewritten to require regime-switching for fuel and demand and a documented copula on residual-value × demand for any procurement larger than $500M.
ModelRisk Functionality Used
- Regime-switching simulation for passenger demand and jet fuel — replaced the prior GBM fuel model and the prior Normal demand model, both of which materially under-priced the shock paths.
- Mixture-distribution residual value at year 12, with the mixture probability copula-linked to the demand regime — the structural correlation that the prior independent-input model missed.
- Real-option valuation computing NPV conditional on year-3 information state, pricing the right to cancel the second tranche.
- P(NPV<0) calculation per procurement option, replacing the prior mean-NPV ranking as the board's primary decision metric.
- Tornado analysis isolating fuel regime, demand regime, and the demand-residual copula as the three drivers worth structuring contracts around.
A deterministic NPV ranking collapses each structure to a single number and treats the firm-40 commitment as interchangeable with the option-bearing one. The Monte Carlo answer is to buy half and price the option to buy the other half — because the right to walk away from the second tranche is worth most in exactly the low-demand states a point estimate never shows you.