

Industry: Aerospace
Product: ModelRisk
Application: Optimizing Aircraft Maintenance Schedules Under Uncertainty
An hour of AOG on a wide-body costs $18,000 — the C-check interval has to be set against that number
A grounded wide-body (Aircraft On Ground, AOG) burns through revenue at roughly $18,000 per hour in lost passenger and cargo yield once recovery, rebooking, and crew positioning are netted. A fleet of 220 narrow-bodies and wide-bodies averages 3.7 unscheduled AOG events per aircraft per year, each lasting a mean 27 hours when a critical component fails between scheduled checks. The airline's deterministic maintenance planning treated C-check intervals as a fixed 22-month constant for the whole fleet.
A Monte Carlo reliability model that costed every candidate interval against simulated wear-out told a different story for each subfleet. Expected total maintenance cost was minimized at a 14-month interval for the high-cycle short-haul narrow-bodies (at $2.02M per aircraft per year) and at a 21-month interval for the lower-cycle wide-bodies (at $2.26M per aircraft per year) — so a single fleet-wide 22-month interval was simultaneously too long for the narrow-bodies and slightly long for the wide-bodies. The cost-versus-interval curves below are where the result lives.
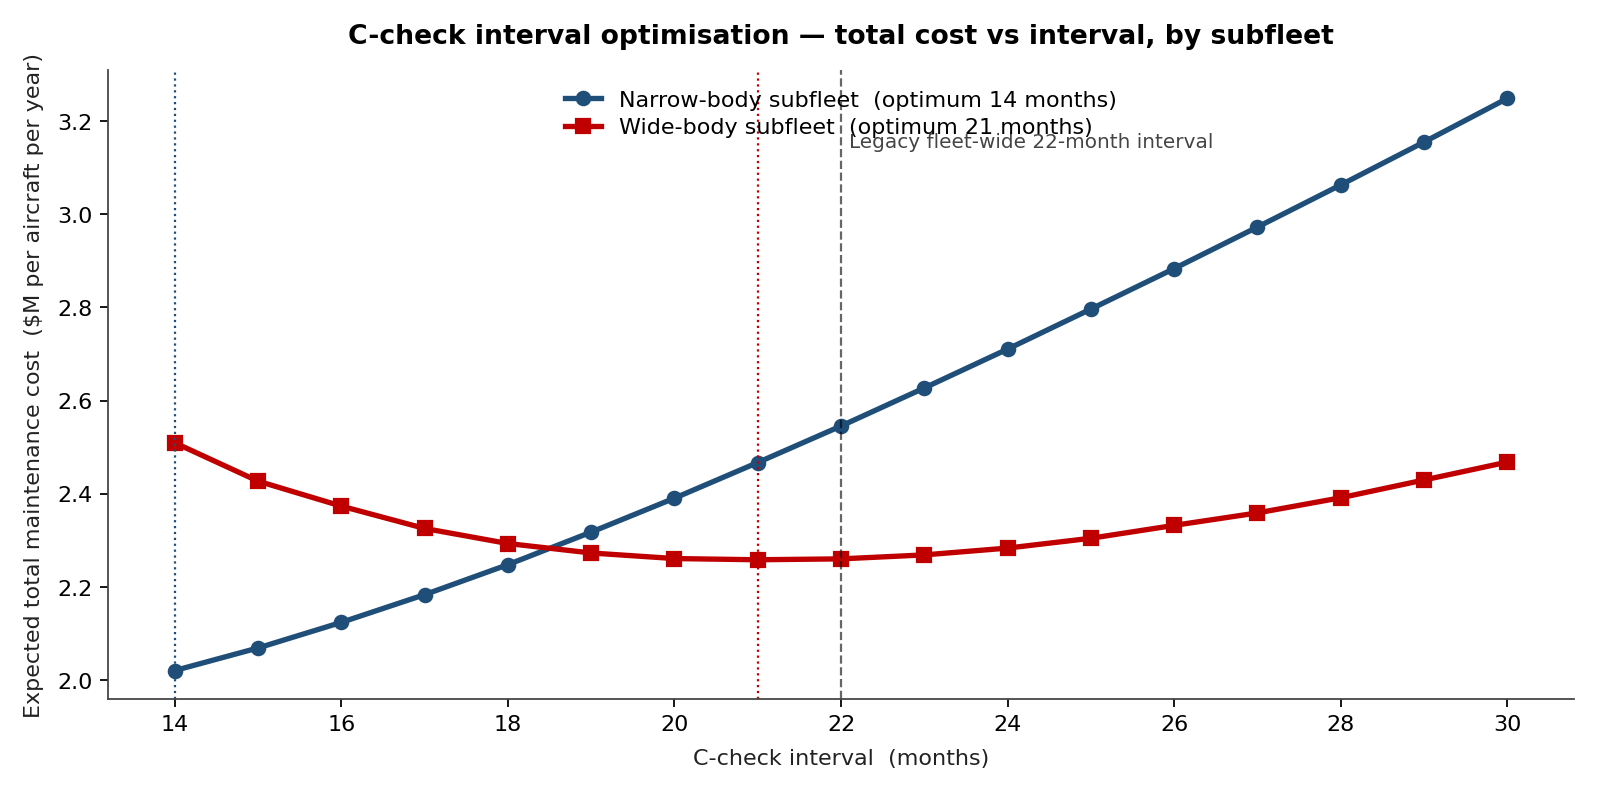
The narrow-body curve rises monotonically from the 14-month left edge: every extra month of interval adds more unscheduled-event cost than it saves in check cost, so the optimum sits at the shortest interval evaluated. The wide-body curve bottoms out at 21 months — its lower cycle rate and higher per-AOG cost reward holding the check slightly earlier than the legacy 22-month floor.
Modeling time-to-failure on the components that ground aircraft
The maintenance planning model focused on the 14 component families that historically accounted for over 80% of AOG events: hot-section turbine blades, fuel control units, hydraulic actuators, IDGs, APU starter-generators, brake assemblies, and so on.
Each was modeled as Weibull time-to-failure rather than exponential, because every one of them exhibited wear-out behavior — shape parameter β well above 1. Hot-section turbine blade replacement followed Weibull(β=2.3, η=18,400 flight hours), calibrated against six years of removal data from the operator's own engine shop. Fuel control unit failure followed Weibull(β=1.7, η=11,200 FH). The exponential model the operator had been using since 1998 implied a constant hazard rate — which was provably wrong from the removal data and was the root cause of unscheduled-event under-prediction.
Inter-component dependence mattered: when an APU starter-generator fails on the ramp, there is a 38% conditional probability that the bleed valve will need replacement within the same maintenance event. This was modeled with a Gaussian copula linking the time-to-event distributions of the seven highest-impact pairs — without that copula, the model underestimated combined-event AOG cost by 22%.
From component reliability to fleet AOG cost
For a candidate C-check interval τ, the per-aircraft annual cost was:
\[ C(\tau) = C_{\text{check}}(\tau) + C_{\text{AOG}}(\tau) + C_{\text{opportunity}}(\tau) \]
where the C-check cost itself is LogNormal (median $480k for narrow-body, $1.18M for wide-body, σ_log = 0.22 reflecting findings variability), AOG cost is the simulated expected unscheduled event cost over the interval, and opportunity cost prices the days the aircraft is out of service for the check (median $410k for the 8-day narrow-body C-check).
10,000 simulated annual operating profiles per candidate interval per subfleet produced the cost-versus-interval curves shown in the opening chart. The minimum for the narrow-body subfleet sits at the 14-month edge: pulling the check forward from 22 months keeps reducing unscheduled events faster than it adds check cost across the entire evaluated range. For wide-bodies, the lower cycle rate and higher per-AOG cost place the optimum at 21 months — earlier than the airline's prior practice of treating 22 months as a "conservative" fleet-wide floor.
Distribution of unscheduled events per aircraft per year
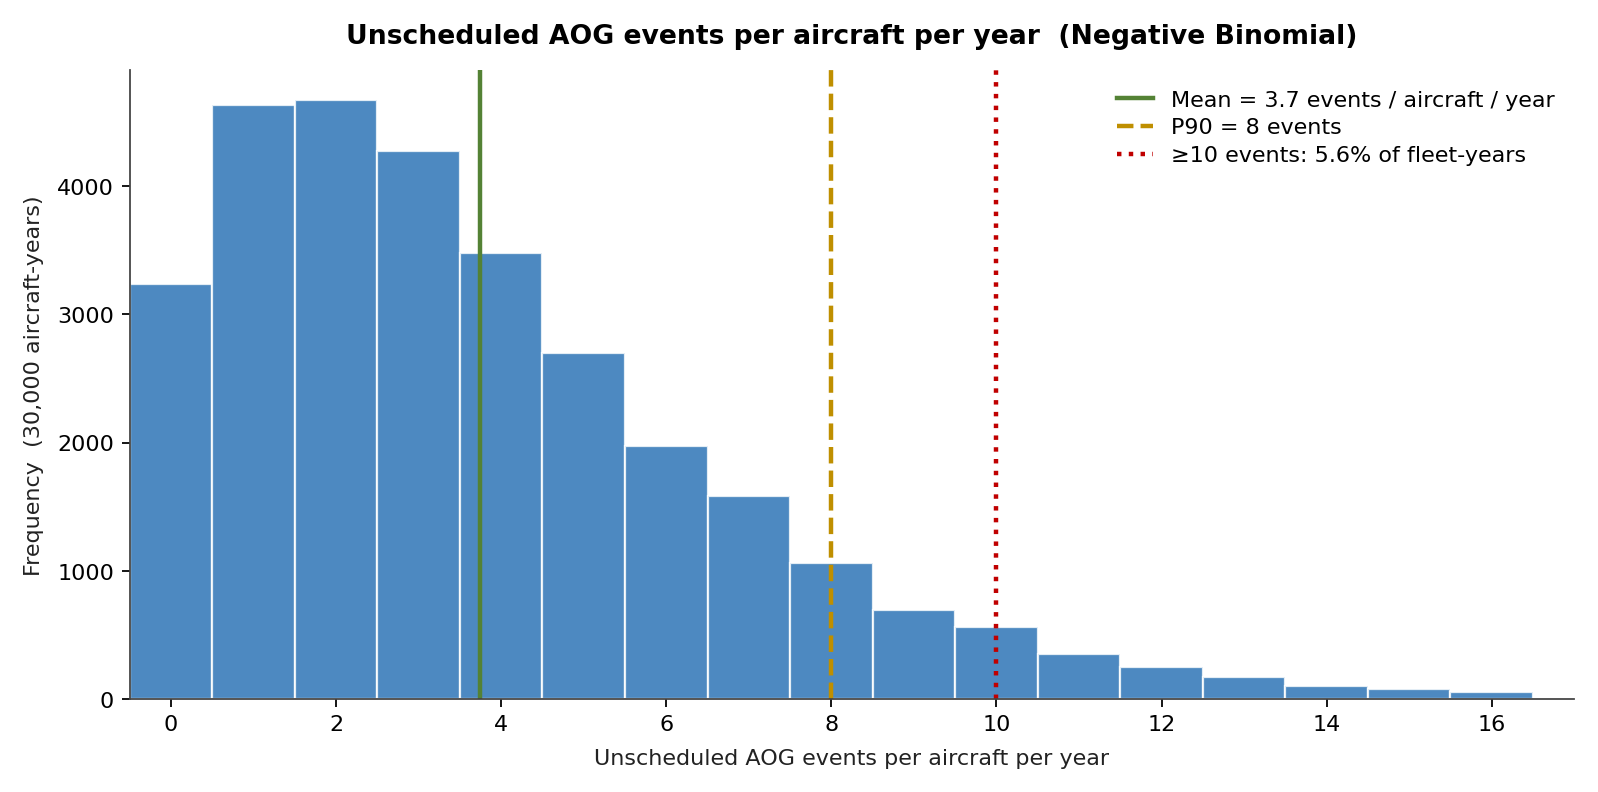
Mean: 3.7 events/aircraft/year. P90: 8 events. About 1 in 18 aircraft (5.6%) will see at least 10 unscheduled events in a year — the spare-parts holding policy and the standby technician roster have to be set against the upper tail, not the mean. The simulation showed that a stocking policy sized to the mean covered only 51% of monthly demand; sizing to P85 lifted coverage to 92% at a stocking cost increase of $2.4M/year — paid for in the first quarter by AOG hours avoided.
What drives the cost variability
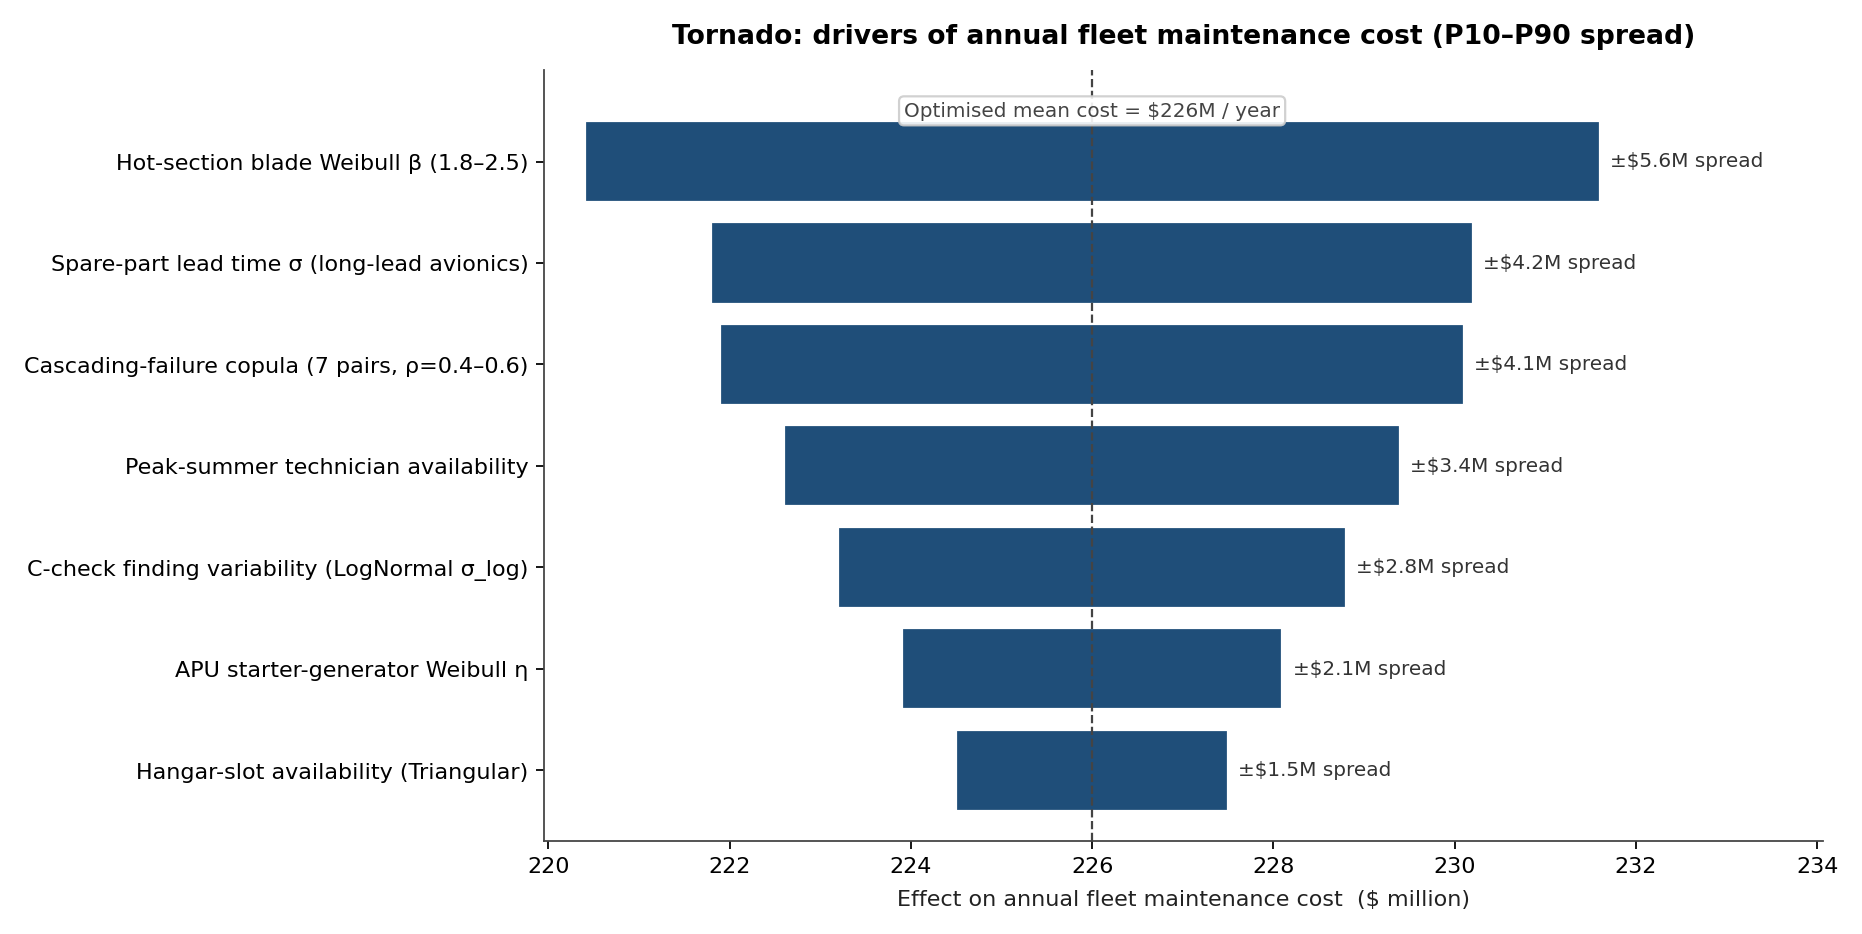
Hot-section turbine blade Weibull shape parameter (β) drives the largest spread — a tighter wear-out distribution (higher β) means later failures are sharply more likely, raising both unscheduled rates and the value of an earlier preventive interval. Spare-part lead time on long-lead avionics is second. Technician availability during peak summer travel is third. APU-bleed-valve copula (the cascading-failure dependence) drives $4.1M of P10–P90 spread on its own — almost entirely invisible to the prior independent-component model.
What the model changed
- Subfleet-specific C-check intervals adopted: narrow-body moved from 22 to 14 months; wide-body moved from 22 to 21 months. Annual fleet maintenance cost fell to a simulated $226M, the optimised baseline the tornado is centred on.
- Spare-part stocking policy moved from mean-demand to P85-demand sizing on 38 critical SKUs, increasing inventory cost $2.4M and reducing simulated AOG hours by 14,200/year (worth roughly $19M in avoided revenue loss).
- The seven highest-impact component-pair dependencies were added to the planning model as documented copula structures; the airline's MRO software was reconfigured to treat these as joint events rather than independent ones.
- Engineering replaced the constant-hazard reliability assumption with Weibull on all 14 critical component families — Weibull parameters are now updated quarterly from the rolling 18-month removal data.
ModelRisk Functionality Used
- Weibull time-to-failure on 14 component families, fitted to six years of removal data — the exponential-distribution legacy model was demonstrably wrong (β values from 1.4 to 2.3, none near 1) and had been systematically under-predicting wear-out events.
- Gaussian copula on seven critical component pairs, capturing the documented cascading-failure dependence — the largest single methodological improvement over the prior independent-event model.
- Per-interval cost optimization numerically minimizing C-check cost + AOG cost + opportunity cost across candidate intervals from 14 to 30 months, per subfleet.
- Spare-parts demand simulation with P85 stocking policy derived from the full demand distribution, not the mean — sized against AOG cost-per-hour, not against inventory carrying cost alone.
- Tornado analysis that exposed the cascading-failure copula as a top-five cost driver — a parameter the prior model didn't have.
A constant-hazard reliability model treats every aircraft as if it never ages — for a fleet with documented wear-out signatures, the right C-check interval depends on a Weibull shape parameter that the exponential model literally cannot represent.