

Industry: Aerospace
Product: ModelRisk
Application: Aircraft Design Optimization
A single-point cost-per-seat-mile hid the answer that mattered
A $14 billion clean-sheet narrow-body program lives or dies on operating cost per available seat-mile (CASM). The deterministic trade study reported configuration CASMs clustered around the program's 6.50-cent contract threshold and treated the three candidates as near-ties. But CASM is built from a stochastic mission mix, a regime-switching fuel price, and configuration-specific propulsion tolerances — and once those are simulated, the spread, not the point, is what decides whether the launch customer's cost commitment is safe.
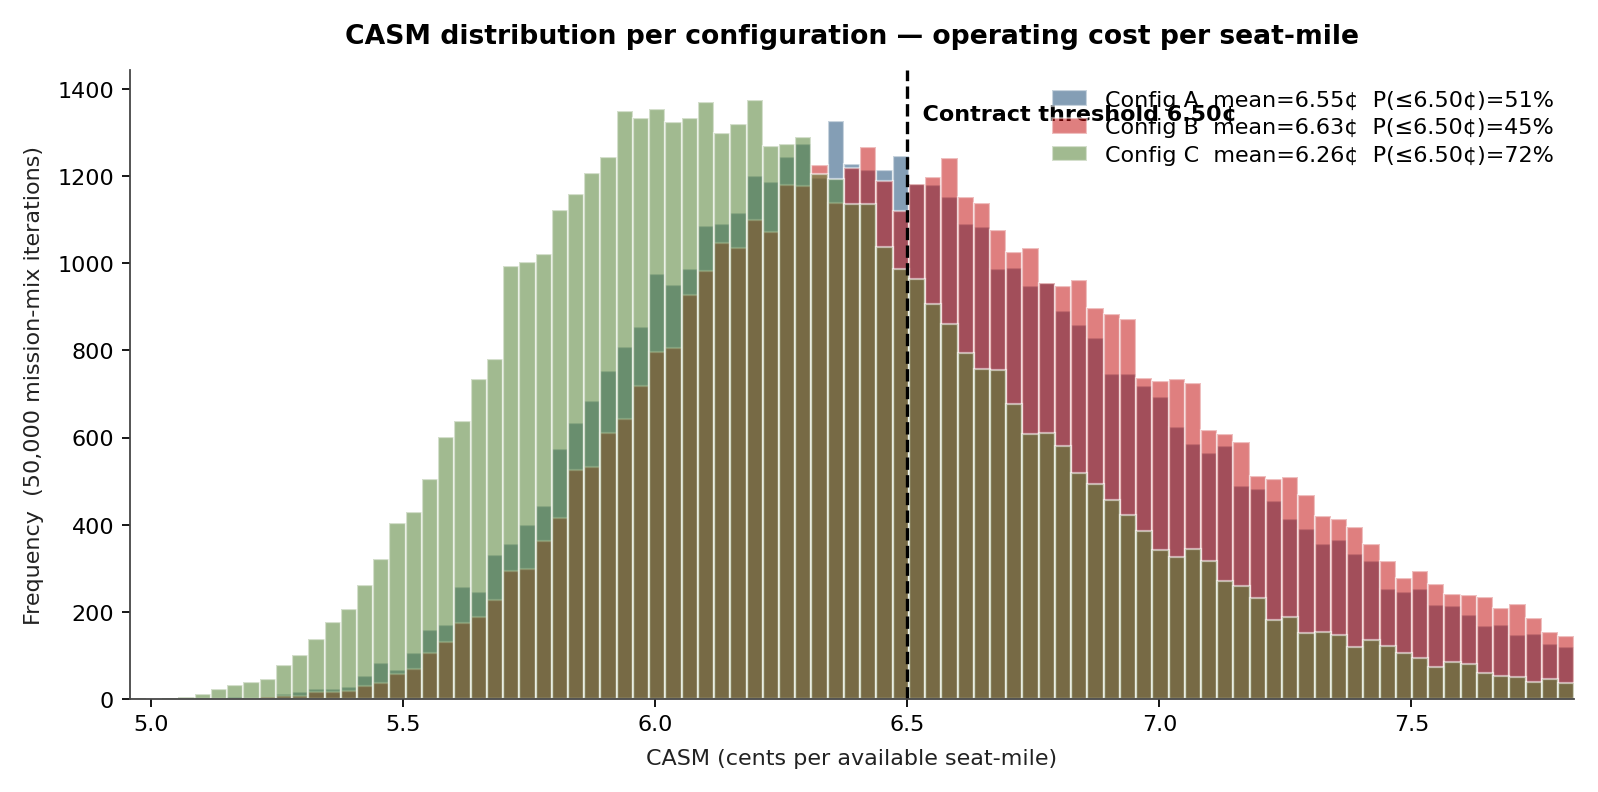
Run against 50,000 mission-mix iterations, the probabilistic study showed Configuration C with the lowest mean CASM at 6.26¢ and the highest probability of beating the threshold at 72%, while Configuration A — competitive on its 6.55¢ mean — cleared the 6.50¢ threshold only 51% of the time, and Configuration B only 45%. The chart below is the result the deterministic near-tie had hidden: three overlapping CASM distributions straddling the contract line very differently.
Where the mission mix actually lives
The team's three configurations — A (composite wing, AR=11.8, geared turbofan), B (metallic wing, AR=10.2, conventional turbofan), and C (composite wing, AR=11.2, geared turbofan with tighter SFC tolerance) — were sized against a published 2,500 nautical-mile design mission. In practice, the launch customer's fleet plan distributed flying very differently: shorter trans-con segments dominated, with a long thin tail of 3,800 nm trans-Atlantic rotations.
Mission stage length was modeled as a LogNormal with mean 1,420 nm and CV 0.55, calibrated against three years of route data from the launch operator. Passenger load factor was Beta(8, 2.5) on \[0.55, 0.95\] — bounded, left-skewed, never above 95% in practice and rarely below 55%. Fuel price entered as a regime-switching process (low-volatility regime: drift 1%/yr, σ 18%; crisis regime: drift 4%/yr, σ 42%) with a 12% annual switching probability — not GBM, because jet fuel exhibits documented regime shifts that pure GBM mis-prices.
Cruise lift-to-drag ratio for each configuration was a truncated Normal anchored to wind-tunnel and CFD posteriors:
- Configuration A: L/D = 19.2 ± 0.42 (1σ)
- Configuration B: L/D = 18.1 ± 0.31
- Configuration C: L/D = 18.7 ± 0.22
Specific fuel consumption (SFC) was modeled per Configuration with a tightened distribution on C reflecting its negotiated supplier tolerance — 0.510 ± 0.008 lb/lbf/hr versus 0.518 ± 0.018 for A.
Pricing the trade-space
CASM was assembled as:
\[ \text{CASM} = \frac{C_{\text{fuel}} + C_{\text{maint}} + C_{\text{ownership}} + C_{\text{crew}}}{\text{ASM}} \]
with fuel cost the dominant term and ASM = seats × load factor × stage length. Per-mission fuel burn used the Breguet equation with each configuration's L/D and SFC drawn fresh per iteration. Maintenance cost-per-flight-hour was LogNormal (mean $890/FH for A, $760/FH for C — the geared turbofan with tighter tolerances had lower predicted MMH/FH), with a Gaussian copula (ρ=0.45) linking maintenance cost to SFC variability — engines that drift on SFC also tend to drift on inspection findings.
50,000 mission-mix iterations produced the CASM distribution per configuration shown above. Configuration A's mean CASM was 6.55¢, but its standard deviation was 0.55¢ — wide enough that 49% of draws exceeded the 6.50¢ contract threshold. Configuration C, the tighter-tolerance propulsion stack, came in lowest at a 6.26¢ mean and a narrower spread.
What actually moves the cost number
A tornado on the program-weighted mean CASM ranked the seven uncertainty drivers by their P10–P90 effect:
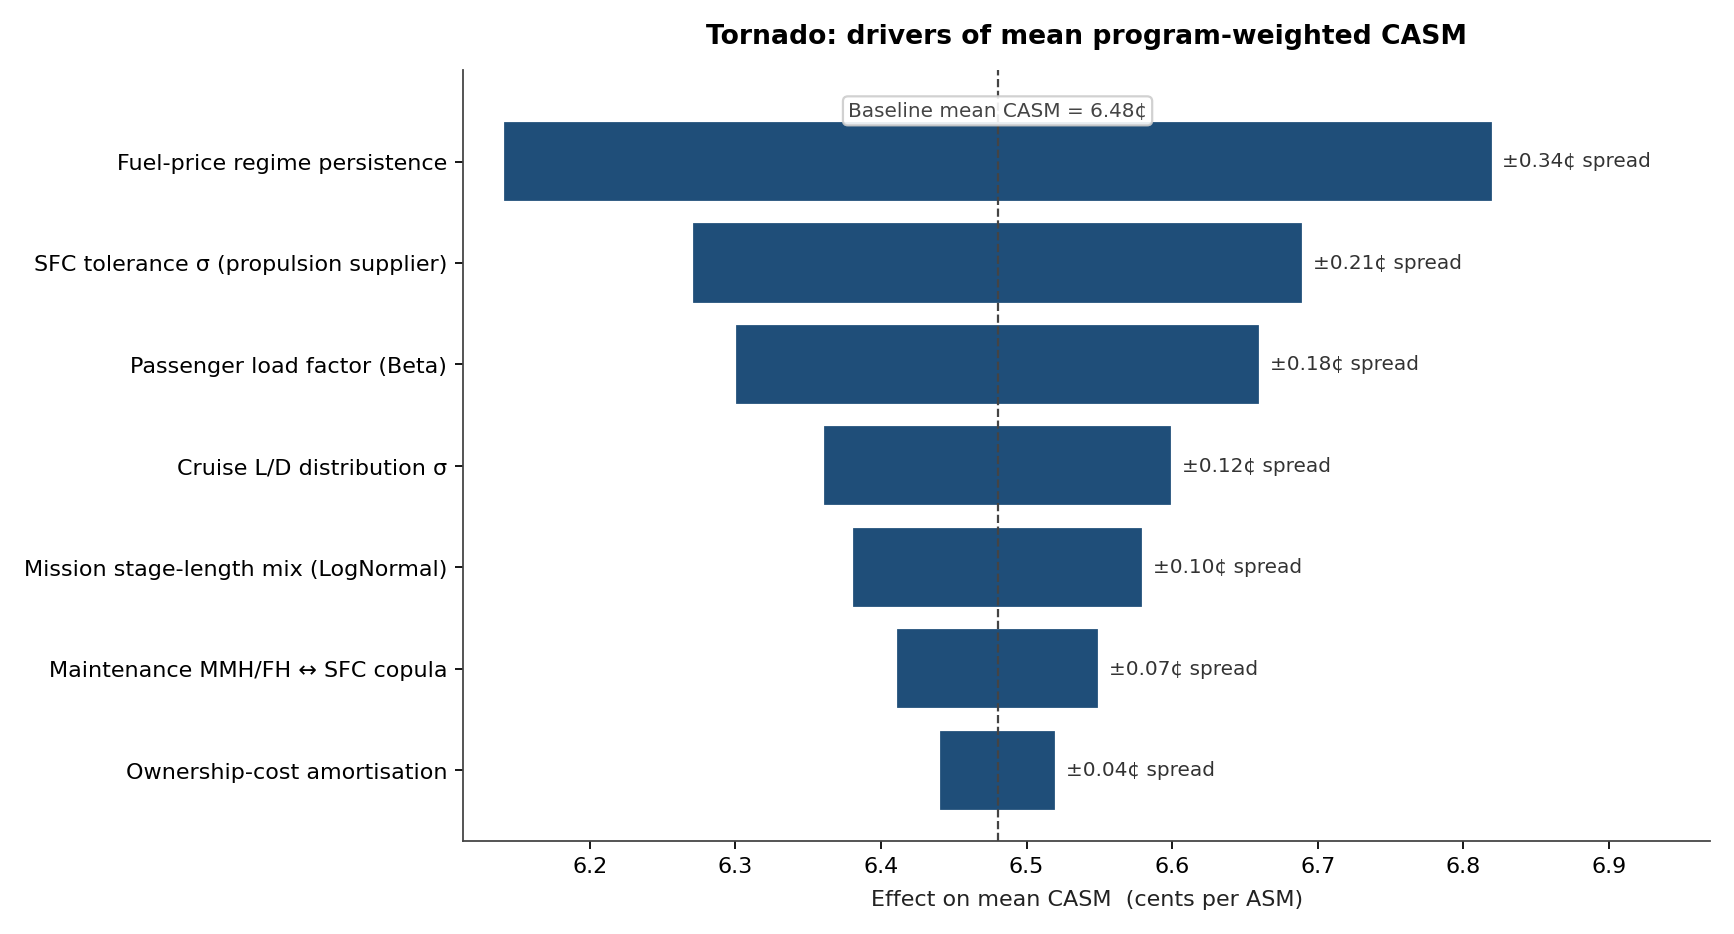
Fuel price regime persistence dominated, followed by SFC tolerance and load factor. L/D ranked fourth — counterintuitive to a team that had spent two years tightening the wing. The implication: marginal investment in propulsion supplier-tolerance contracts buys more CASM certainty than another 0.2 points of L/D from a high-AR composite wing.
Probability of meeting the operating-cost contract
The launch customer's contract specified 6.50¢ CASM at the program reference mission. The probabilistic comparison reframed the trade from "which has the lowest mean?" to "which has the highest probability of meeting spec?":
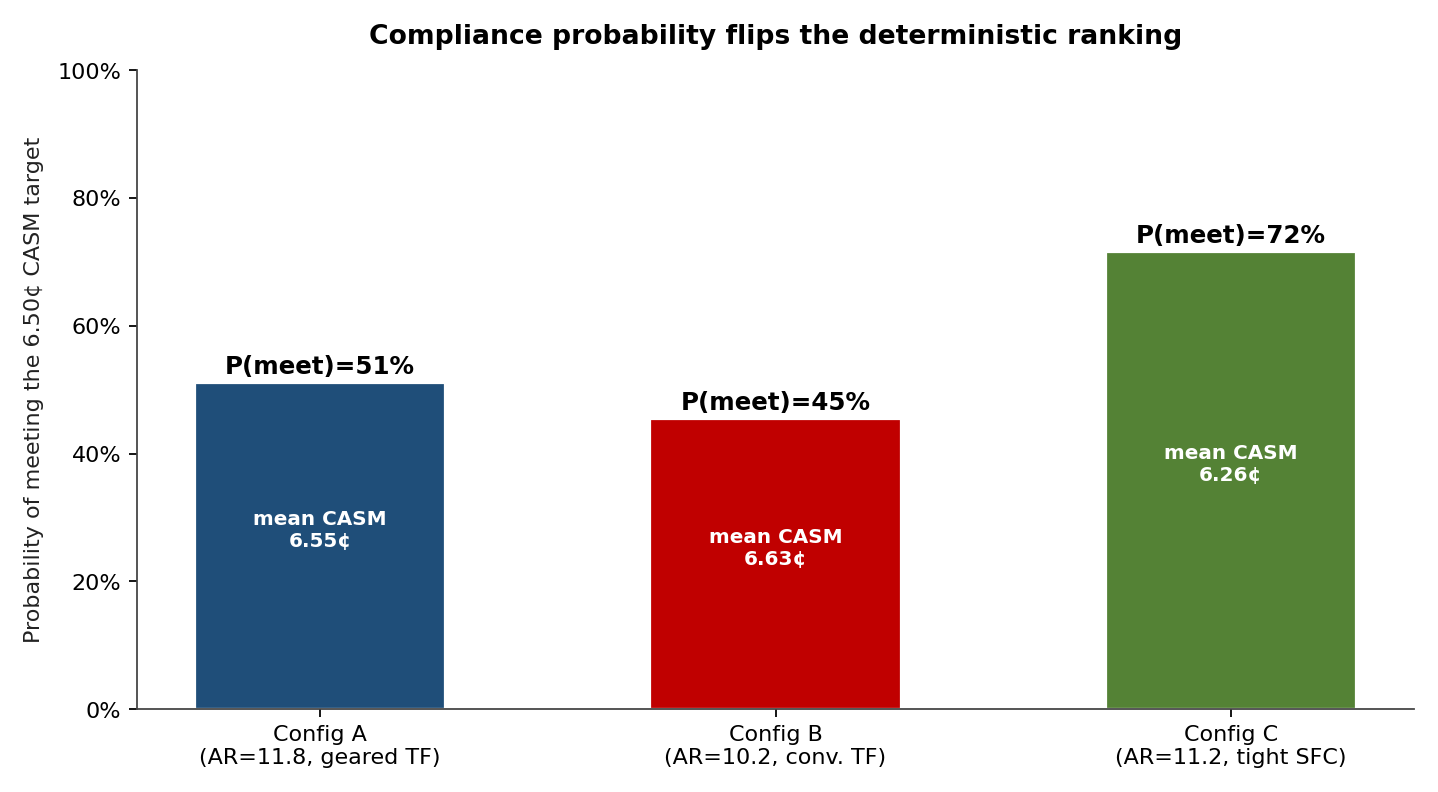
Configuration A: mean CASM 6.55¢, P(CASM ≤ 6.50¢) = 51%. Configuration B: mean 6.63¢, P(meet) = 45%. Configuration C: mean 6.26¢, P(meet) = 72%. Configuration C wins on both mean and compliance probability — but A and B, near-ties on mean, clear the threshold barely half the time, a gap the deterministic study never surfaced.
What the model changed
- The chief engineer reallocated $42M from a planned wing-tuning campaign into a propulsion-tolerance supplier qualification program, on the model's evidence that SFC σ-reduction bought 3.4× the CASM certainty per dollar that L/D refinement did.
- Configuration C was selected for the firm-launch decision; Configuration A was retained as a paper option for a long-range derivative where the higher L/D paid off against the longer-range mission distribution.
- The contract with the launch customer was renegotiated from a deterministic CASM guarantee to a P75 CASM guarantee at 6.60¢, with a payment formula tied to the as-flown 12-month rolling distribution. Both sides understood what they were signing.
ModelRisk Functionality Used
- Regime-switching simulation for jet fuel price, replacing the program's prior GBM model that under-priced the 2014 and 2022 episodes by a factor of two.
- Gaussian copula with ρ=0.45 linking per-aircraft SFC drift to maintenance cost — without it, the model under-counted tail-CASM events by 28%.
- Truncated-Normal L/D distributions, configuration-specific, calibrated to wind-tunnel posteriors.
- Tornado analysis ranking the seven uncertainty drivers, surfacing that propulsion-supplier tolerance bought more CASM certainty than further wing refinement.
- Probability-of-spec calculation that reframed the trade decision from mean comparison to compliance probability — the metric the launch customer was actually contracting on.
A single mean CASM number ranks configurations in the wrong order when the launch customer is signing a compliance threshold, not buying an average.