
IDW PS 340 software requirements
Regulation document: IDW PS 340 n.F. “Die Prüfung des Risikofrüherkennungssystems” 1
Country: Germany
Date: 25 May 2020
Regulating body: Institut der Wirtschaftsprüfer (IDW, Institute of Public Auditors)
Applies to: Businesses that are publicly-listed in Germany
Link: IDW bookshop
Summary
IDW PS 340 is an auditing standard to be use by auditors of German listed stock corporations. The focus is on ensuring that corporations have an early detection system for “risks that threaten the continued existence of the company” 2 – a phrase used 68 times in its 28 pages. I’ll call these Existential Risks for short. It applies to reporting periods that start from January 2021 onwards.
Summarizing the key elements:
- It defines risks as developments or events than can lead to a negative deviation from the company’s objectives 3
- It defines risk bearing capacity as the maximum extent of risk that the company can bear without endangering its continued existence 4
- It is the risk monitoring system that is the centre of focus, not the data within the system
- The outcome of the audit is to state whether the internal risk monitoring system needs to be improved
- Identified risks are systematically documented in a risk inventory
- Risks must be identified across the whole company
- Risks must be assessed for their probability of occurrence, their possible effects, and their interdependencies
- Risks are systematically aggregated 5
- The system has a formal reporting procedure with a regular cadence, but includes fast track reporting to the Board of Directors for Existential Risks
- The executive board make decisions about how to control Existential Risks, and those decisions need to be documented
Examples of risks that need to be included
IDW PS 340 provides the auditor with a number of examples that could be considered existential risks. For example:
- Threat to the business model, e.g. through environmental protection regulations
- Loss of licenses or concessions necessary for operations
- Bad investments
- Entry of new competitors into the market, or constantly declining sales
- Business interruptions for which there is insufficient business continuity management
- Use of speculative financial instruments that lead to the company's insolvency
- Loss of access to debt (e.g. due to a reduction in the company's rating) and liquidity bottlenecks
- Macroeconomic factors such as tariffs or termination of trade contracts lead to profound price changes
- Violations of regulations that lead to severe penalties and/or reputational damage
Why IDW PS 340 is important
One would be forgiven for thinking that IDW PS 340 encapsulates common sense risk management that all publicly traded businesses should be practicing. In essence, it says: Look at the total risk you face, determine the likelihood you would survive, ensure the board knows about how the business could fail, do what you can to ensure survival, and make sure investors are aware of the residual chance of the business failing.
Reality, however, is that the various sources of risk are assessed and managed by quite different corporate functions, using different and often incompatible evaluation methods. These risk management functions operate in silos and there is no mechanism for aggregating the exposure to one common measure.
Take, for example, the world of GRC (Governance, Risk management and Compliance). Risk managers in this domain focus on ensuring adherence to regulations by ensuring that the business keeps up with the latest laws, that business processes are created to meet these regulations, responsibilities assigned appropriately, and necessary actions to comply are documented. It is largely an administrative problem and may involve monitoring the activities of thousands of people. There are many GRC software platforms for supporting this, and almost without exception 6 they use qualitative risk scores and heat maps for evaluating and comparing risks.
Risk scores are well-known for being logically inconsistent and misleading, but they have the appearance of simplicity and remain very popular 7. They are used almost ubiquitously in operational risk management for constructing and evaluating risk registers. A Google Images search for “risk register” will illustrate that very well. IDW PS 340 may herald the much overdue demise of the qualitative risk score. It has certainly been extremely hard for GRC software vendors to defend their products as fit-for-purpose in the face of this regulation.
IDW PS 340 is ultimately very important because it talks about aggregation of risk and incorporating common causal factors; it puts event-based risks like a change of regulation, loss of license, or tariff changes in the same pot as continuous risks like cashflow uncertainty, commercial losses and business interruptions; and it states that one needs to determine the probability that the aggregate risk exposure exceeds the financial capacity for the organisation. The set of requirements can only be met using quantitative risk analysis, specifically Monte Carlo simulation. IDW PS 340 is implicitly forcing risk managers to stop using risk scores as an evaluation method and rejects heat maps as being adequate for evaluating total risk exposure. It is the first enterprise risk management regulation we are aware of that has taken this step, which represents real progress in my view.
How a risk management system meets IDW PS 340 requirements
Working backwards, a risk identification and evaluation system that meets IDW PS 340 requirements will need to project the future cashflow position at a certain point in time (say a year from now), aggregating across all material risks and uncertainty. That forecast will be a probability distribution, and the only way to produce such a distribution is using Monte Carlo simulation. The maximum amount the organisation can raise, by selling disposable assets and investments or by taking on debt, to cover any negative cashflow position is then compared against that distribution.
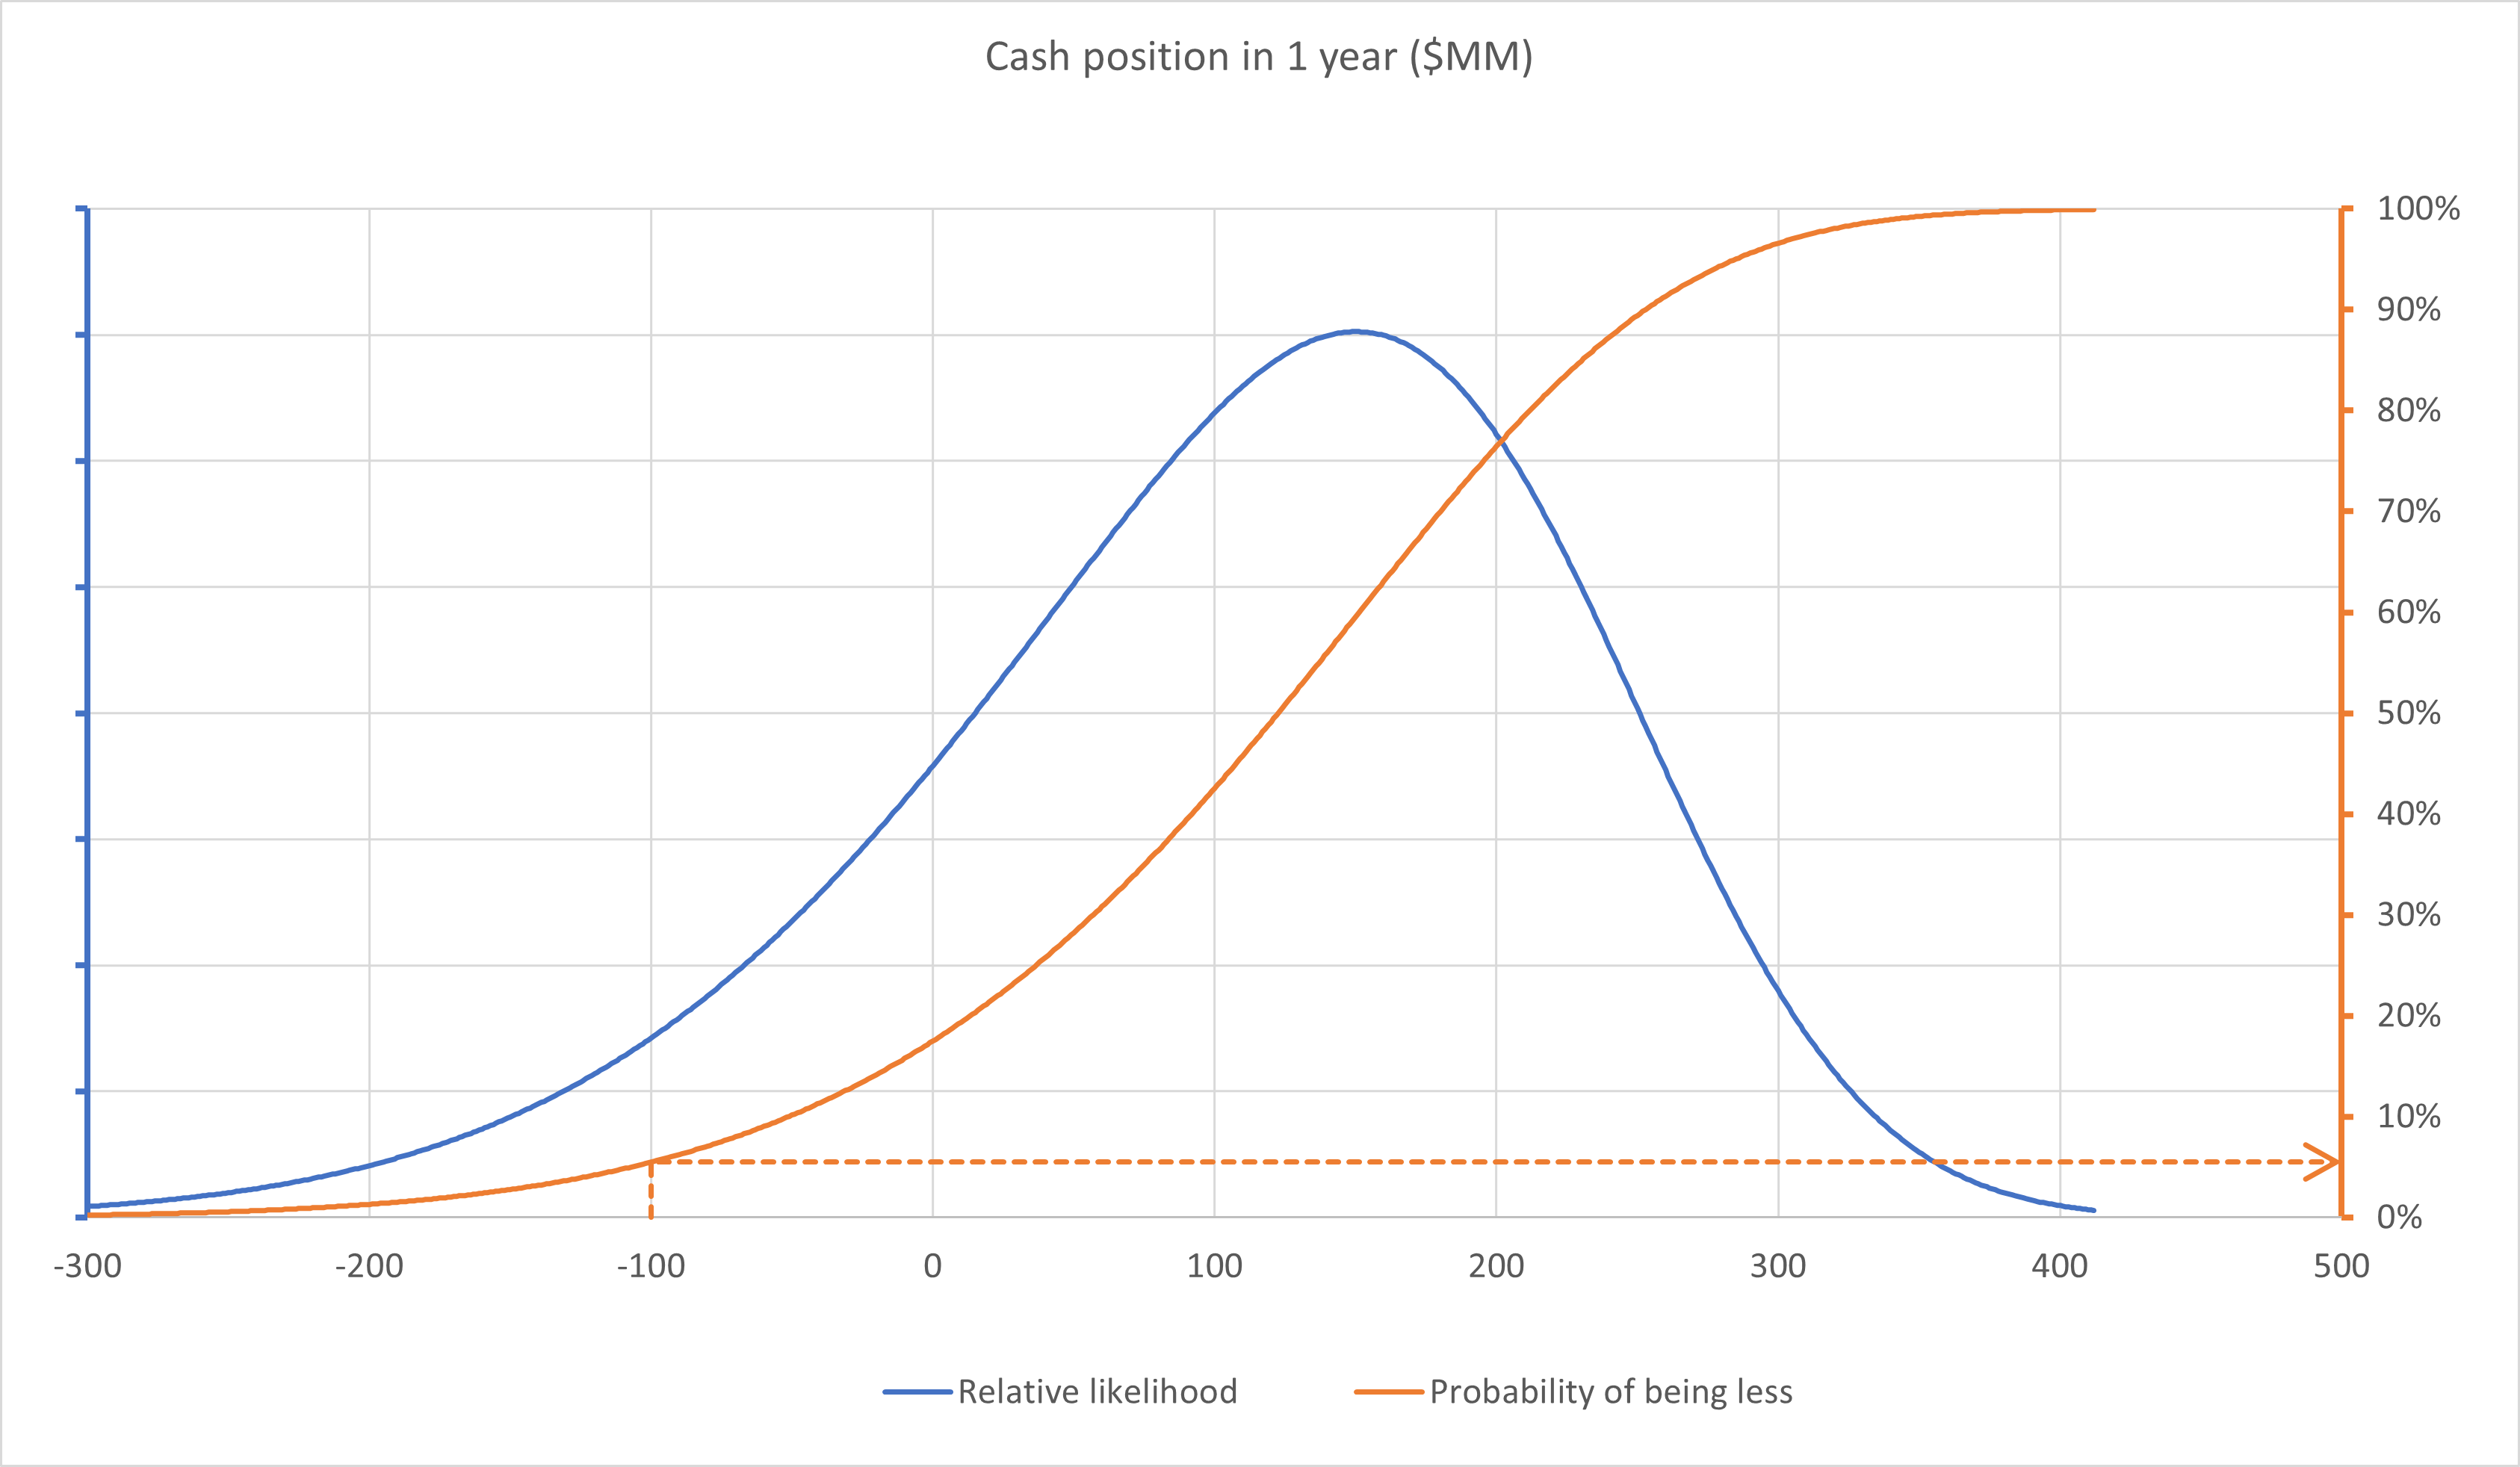
For example, in the figure above the cashflow position in one year has been estimated and compared against the $100 million the organisation believes it could raise if needed, which is its risk bearing capacity. The graph shows that there is about a 5% chance that this would not be enough.
A 5% probability of default demotes the corporation to a speculative-grade investment. Management would normally like to see this risk fall to 1% or lower to keep an investment-grade rating. Breaking down the model that generated the forecast cashflow position to find the key risk drivers, assessing the different risk management scenarios for controlling the tail risk, and playing with different divestment strategies for achieving a better risk-reward balance are standard risk analysis techniques.
How risks and uncertainty are aggregated
A typical forecast of the future cashflow position of an organisation is performed using a spreadsheet model (Excel) with a Monte Carlo simulation add-in like ModelRisk. The model breaks down forecasts for revenues, costs, any liabilities, etc in a standard accounting format. The Monte Carlo simulation add-in allows for any uncertainty in these accounting lines. Every corporation needs its own model to describe its unique circumstances. The effects of macro-economic factors can be added (like inflation, interest rates, exchange rates). Excel will allow imports from external data services that can ensure the model is kept up-to-date automatically.
The model needs to incorporate external factors specific to the business that drive one or more variables. For example, reduced availability of key materials (like microchips) can both decrease the production volume and increase the unit cost of manufacture. Conversely, increased availability will have the opposite effect. Such external factors can create a lot of correlation between cashflow lines. The correlation usually has the effect of extending the tails of the cash position distribution, so failing to incorporate them will underestimate the probability of exceeding the corporation’s financial capacity.
Market event-based risks like the entry of new competitors should also be included. When a new competitor enters a market, it will reduce the volume of sales the corporation makes and usually reduce the sales price. Other market risk events are things like losses of major contracts and the dissolution of a partnership. Such market event-based risks have their converse, sometimes called opportunities – for example, the retirement of a competitor from the market, winning a new major contract, or acquiring a new partner. Market risk events can have several impacts at different places on the cashflow creating correlation.
Another category of risk is operational. These are event-based risks that occur from failures of business processes, criminal activity or human mistakes - things like internal fraud, cyber-attacks or a regulatory infraction. The do not have converse opportunities. Operational risks can have multiple consequences – for example, recall of a product that failed to meet some regulatory standard will incur the direct cost of the recall, some reimbursements, perhaps a reduction in future sales, or even a complete withdrawal of the product.
A further type of risk that is often overlooked is the delayed completion of strategic projects, like the launch of a strategically important new product or the completion of an investment building. Delays are common for large projects with attendant cost overruns and delays to the cashflows they generate. Occasionally, a large project will fail completely and has been known to ruin a company.
Which risk identification software system should be used for IDW PS 340
- Online simulation spreadsheet
- Risk register platform
- Project cost and schedule risk analysis
A spreadsheet model is the easiest way of collating all the risk data and producing a cash position forecast because it offers the flexibility to model the complete picture with all the interactions. If the spreadsheet is hosted online and its simulation results are displayed in a dashboard for anyone with the required permission to access, the IDW PS 340 requirement of fast-tracking informing the board can be met.
Operational risks are typically recorded, evaluated and reported in a GRC (Governance, Risk management and Compliance) platform. These are usually SaaS, allowing a very large number of users access to the system to document compliance with regulations and internal processes. Unfortunately, the focus of GRC platforms has historically not involved any type of analysis so the data they collect are qualitative (e.g. describing likelihood and impact of a risk as low, medium, high). They don’t collect meaningful information about the inter-relationships between risks (e.g. that they could come from a common route cause and so are more likely to coincide), neither do they provide any means to describe how a risk could occur more than once or that it may have several consequences.
At the time of writing, several GRC platforms have stated that they intend to release a quantitative capability, but only one has appeared so far.
If the organisation is dependent on the successful execution of one or more projects, it will need a suitable project risk analysis tool Several are reviewed here.
How Vose Software can help
Vose Software’s Integrated Risk Management system includes all the components described above:
- Pelican Risk Register – a fully quantitative risk register with bowtie analysis for risk management optimization, heat maps, etc. This can be connected to a GRC system.
- Tamara Project Risk – for project cost and schedule risk analysis. It can import risks from the Pelican Risk Register and publish data back
- ModelRisk for Excel – simulation in Excel with tools to import from the Pelican Risk Register, Tamara Project Risk and external data sources
- Pelican IRM – tools to host the spreadsheet models online, automate re-simulation, create dashboards, and interface with other BI tools used by the boardroom
Vose Software also have over 30 years of consulting experience in building cashflow risk models.
Interested in investigating how our software could help you with IDW PS 340?
- 1 “Testing the early risk detection system”
- 2 “fortbestand der Gesellschaft gefährdende Entwicklungen früh erkannt werden”
- 3 “Entwicklungen oder Ereignisse, die zu einer für das Unternehmen negativen Zielabweichung fuhren können”
- 4 “Maximales Risikoausmaß, welches das Unternehmen ohne Gefährdung seines Fortbestands tragen kann”
- 5 “Risiken werden systematisch aggregiert”
- 6 At the time of writing, the notable exception is Archer that offers an optional ability to use a quantitative evaluation method.
- 7 Some of the shortcomings are described in a LinkedIn article here.