Can't read this? Click here .

In This Newsletter
New training course is available
Who uses ModelRisk?
Feature of the month: Spider plot
Call to all software developers: ModelRisk OEM

New training course is available
 The purpose of risk analysis modeling is to provide decision-makers facing significant uncertainty with the best possible information. Risk analysis models need to be easy to understand, check and review and as close as possible to what the analyst would like to be able to model. The set of ModelRisk tools go far beyond what has been traditionally available in Monte Carlo software, removing much of the challenge people have faced to bridge the gap between what they want to describe and the limitations of what their software will let them say.
During this short course, you will learn how to use these tools efficiently to solve complex real-world problems by building high-quality risk analysis models. ModelRisk Professional and Industrial users will find this online training particularly useful as the course material makes strong use of the features that these products offer. ModelRisk Standard users that wish to learn more about modeling are also welcome to attend this course and will be provided an extended trial of the ModelRisk Industrial edition.
Topics:
- More advanced probability distributions
- Correlation structures
- Time series models
- Fitting models to data
- Expert elicitation tools
- Probability calculations
- Extreme value modeling
- Markov chain models
- Database connectivity
- Stochastic optimisation
The training course will take place online on 25-26 April 2012 in two sessions of 4 hours (1PM-5PM GMT convert to your time zone) . Participants will also be provided with the presentation slides that will be used during the course as well as extra notes, example models and a copy of the training in an offline video format.

You can also contact training@vosesoftware.com or call one of our offices.
Who uses ModelRisk?
ModelRisk is used by more than 3500 organizations worldwide. Our users come from a very broad set of industries because of the highly flexible set of tools that ModelRisk offers. We performed a study of our users to help us figure out the best range of training and services we could provide. In the pie chart below you will see an overview of industry fields where ModelRisk is used.
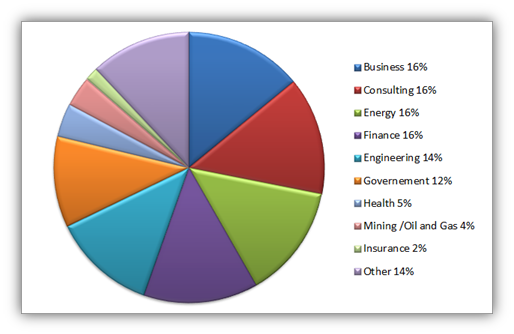
When we talk to users from different industries we see there is a cross use of features. A few examples are provided below:
- The Extreme value tool is often used in the Insurance and Finance industries to calculate the probability and impact of extreme loss events, while it is also used in Engineering to estimate the risk of failure in extreme weather conditions. Pharmaceutical companies, on the other hand, it to estimate the probability probability of an adverse effect after exposure to their product by people with extreme levels of sensitivity.
- The Finance, Business, Energy and Mining industries use ModelRisk’s time series capabilities to forecast demand, production, costs and revenues.
We’re convinced that no matter in what industry you work, you will be able to quantify and review your risks with ModelRisk. For a small overview of projects we have completed in different industries, click here.
We provide a newsfeed service via the Vose Account application that comes with ModelRisk. The newsfeed attempts to provide you with the most relevant information according to the industry you state that you work in. To receive a more targeted newsfeed, please make sure your profile is as up-to-date as possible. Click here to get instructions on how.
Feature of the month: Spider plot
Spider plots are used to visually describe how sensitive the value of an output variable is to the input variables of the model. The spider plot below shows the sensitivity of the mean of the total revenue to the six input variables it is dependent on.
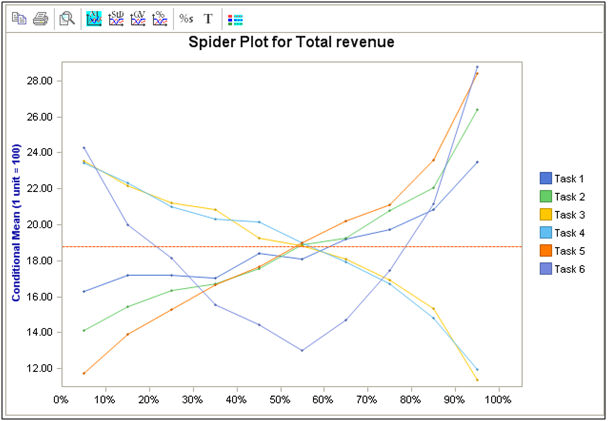
Click here to learn how to interpret the plot above
Why use spider plots?
The sensitivity analysis tool most commonly offered in Monte Carlo simulation is a tornado plot using rank order correlation, which provides a statistical measure of correlation between the input and output generated values. However, this leaves the user with the task of trying to understand how important a (for example) 0.63 rank order correlation is to their business decision. ModelRisk’s spider plots give a sensitivity scale in terms of the output value, which is far more intuitive to the user.
Moreover, correctly performed spider plots allow one to analyze output sensitivity in situations where rank order correlation, or even regression-type analysis, would fail to pick up any significant relationship. For example, in the plot above the output mean has a ‘U-shaped’ sensitivity to Task 4. A simple regression or correlation analysis would show a very small correlation, yet Task 4 has a very large impact.
Call to all software developers: ModelRisk OEM
Our ModelRisk software is built on a set of unique, powerful, and flexible software algorithms designed to handle almost any risk modeling issue. If you are a software developer, and are interested in embedding ModelRisk features into your own software, you don’t need to ‘reinvent the wheel’. Contact us instead to see how we can work together to add powerful probability and simulation tools to your application.
If you are interested in our OEM program, please contact our head of software development, Timour Koupeev.